Histograms
1. The histogram shows information about the times taken by some students to finish a puzzle.
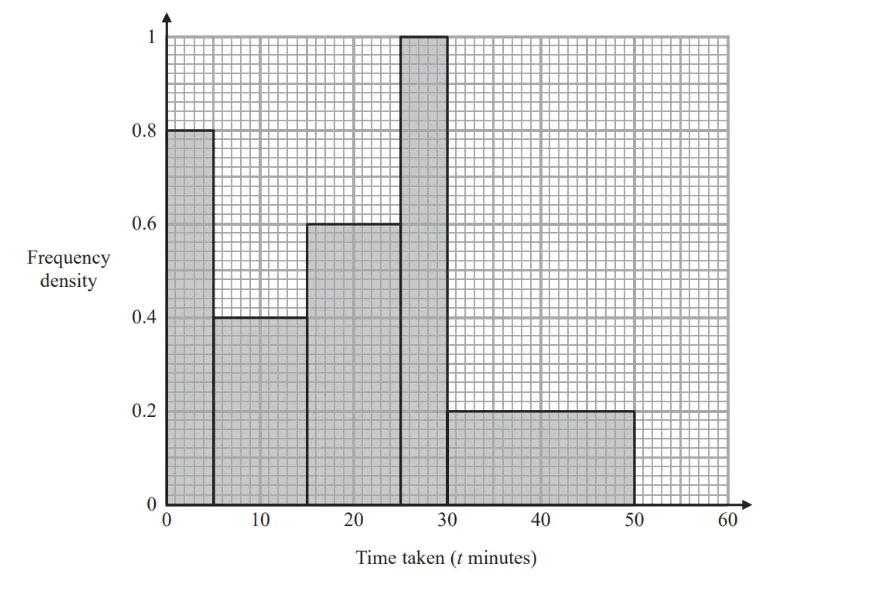
Complete the frequency table for this information.
Time taken ( minutes) | Frequency |
0</p></td><td><p style="line-height: 1.7" class="text-lg tracking-wide font-normal leading-relaxed">\(4 | |
\(5 | |
\(15 | |
\(25 | |
\(30 |

Ai এর মাধ্যমে

১০ লক্ষ+ প্রশ্ন ডাটাবেজ

প্র্যাকটিস এর মাধ্যমে নিজেকে তৈরি করে ফেলো
উত্তর দিবে তোমার বই থেকে ও তোমার মত করে।

সারা দেশের শিক্ষার্থীদের মধ্যে নিজের অবস্থান যাচাই
The histogram gives information about the distribution of the weights of some onions grown by a farmer.
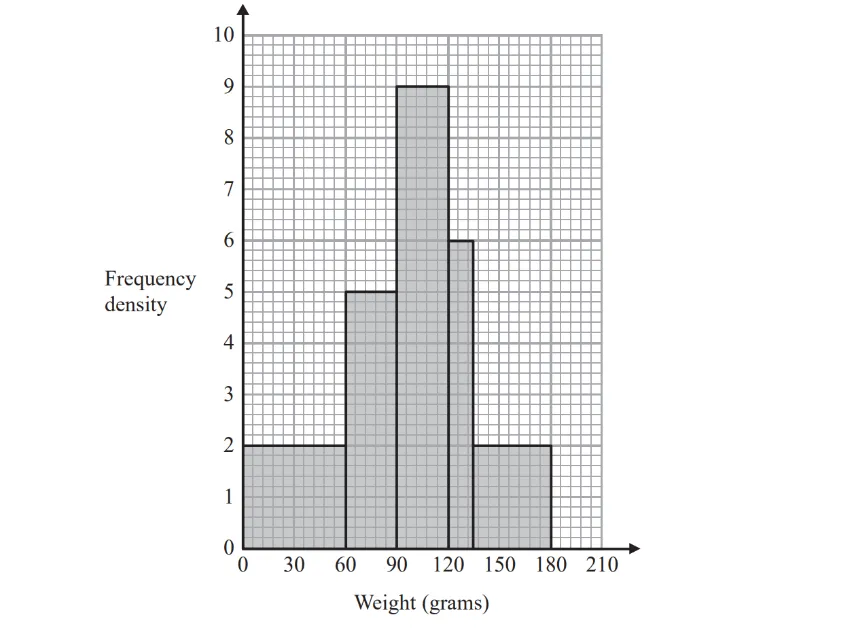
Onions less than 60 grams in weight are used for pickling. Onions greater than 120 grams in weight are sold at the market. The rest of the onions are sent to a food processing factory.
A pie chart is drawn using the information opposite to show what the farmer does with the onions he grows.
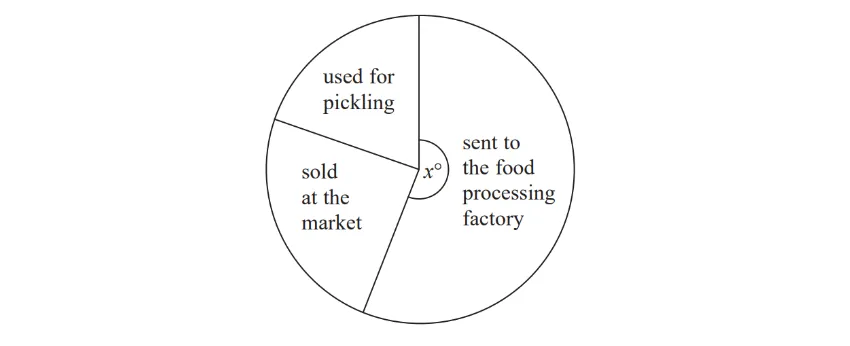
The angle of the sector for the onions sent to the food processing factory is .
Work out the value of .
30 students completed a puzzle and their times were recorded. All of the students completed the puzzle in less than 50 seconds. The histogram shows information about some of their times.
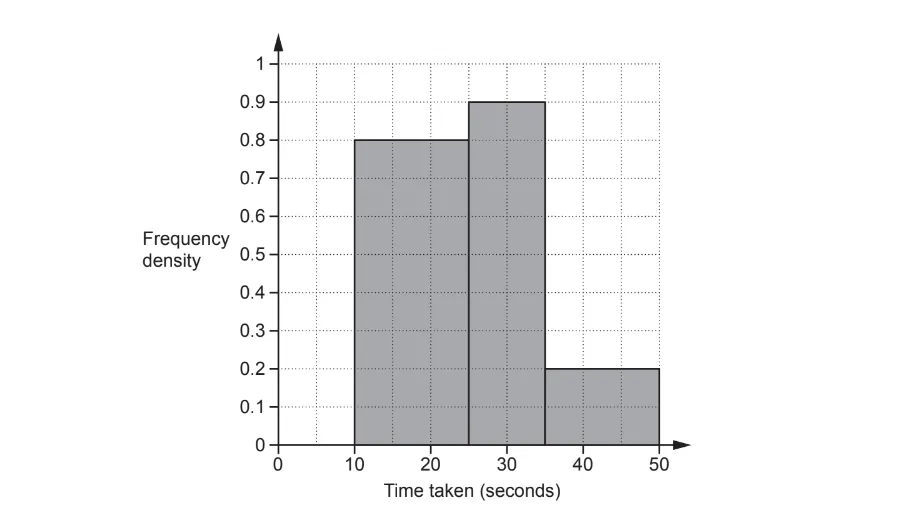
Complete the histogram for those completing the puzzle in less than 10 seconds.
The histogram shows information about the time taken by cyclists to finish a cycle race.
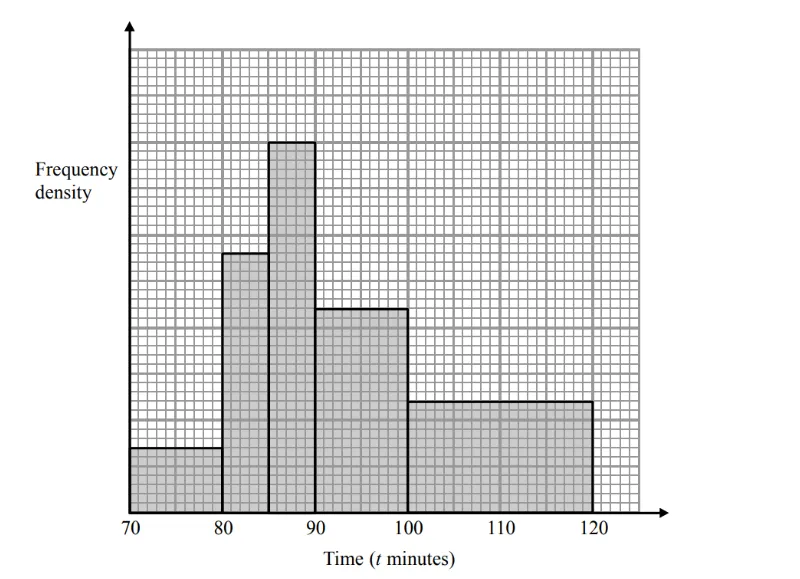
7 cyclists took 80 minutes or less to finish the race.
i) Work out an estimate for the number of cyclists who took more than 105 minutes to finish the race.
[3]
ii) Explain why your answer to part (i) is only an estimate.
[1]
The histogram shows some information about the weights of a sample of apples.
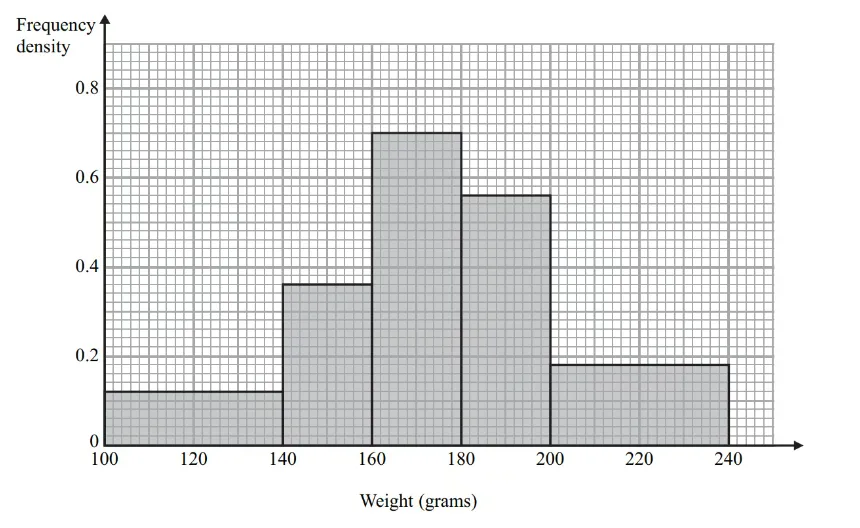
Work out the proportion of apples in the sample with a weight between 140 grams and 200 grams.

