Graphs in Kinematics
1. This question has 3 part(s).
1.1. A ferry sails in a straight line from the harbour at to its destination , passing the checkpoint on the way.
Figure 1 shows the displacement–time graph for the journey.
Displacement, is measured in metres from , and time is measured in seconds.
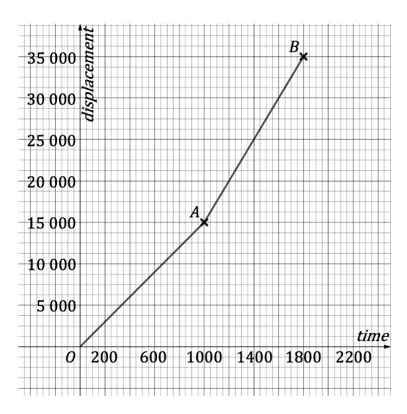
Using the information in Figure 1, calculate the constant velocity of the ferry while it is travelling from to .
1.2. Find the average speed of the ferry as it travels from to .
1.3. The ferry company would like the journey to be completed within a maximum time of 25 minutes. Find, to three significant figures, the average speed the ferry would need to travel at in order to achieve this.

Ai এর মাধ্যমে

১০ লক্ষ+ প্রশ্ন ডাটাবেজ

প্র্যাকটিস এর মাধ্যমে নিজেকে তৈরি করে ফেলো
উত্তর দিবে তোমার বই থেকে ও তোমার মত করে।

সারা দেশের শিক্ষার্থীদের মধ্যে নিজের অবস্থান যাচাই
No related questions found

