3. Movement into & out of Cells
1. This question has 6 part(s).
1.1. A student investigated the effect of different concentrations of salt solution on a hollow plant stem.
They were provided with a 2% salt solution and distilled water. The student used these to make up different concentrations of salt solution.
Step 1 | Four test-tubes were labelled 1, 2, 3 and 4. |
Step 2 | The information in Table 1 was used to make up the four different salt solutions in the test-tubes. |
Table 1
Test-tube | Volume of 2% salt solution / cm3 | Volume of distilled water / cm3 | Final percentage concentration of salt solution |
1 | 0 | 20 | 0.0 |
2 | 5 | 15 | |
3 | 10 | 10 | 1.0 |
4 | 20 | 0 | 2.0 |
(i) Complete Table 1 by calculating the final percentage concentration of the salt solution in test-tube 2.
[1]
Step 3 | The contents of each test-tube were poured into four Petri dishes labelled 1, 2, 3 and 4. |
Step 4 | A hollow stem was cut into 12 rings using a sharp scalpel. Each stem ring was approximately 2mm long, as shown in Fig.1 |
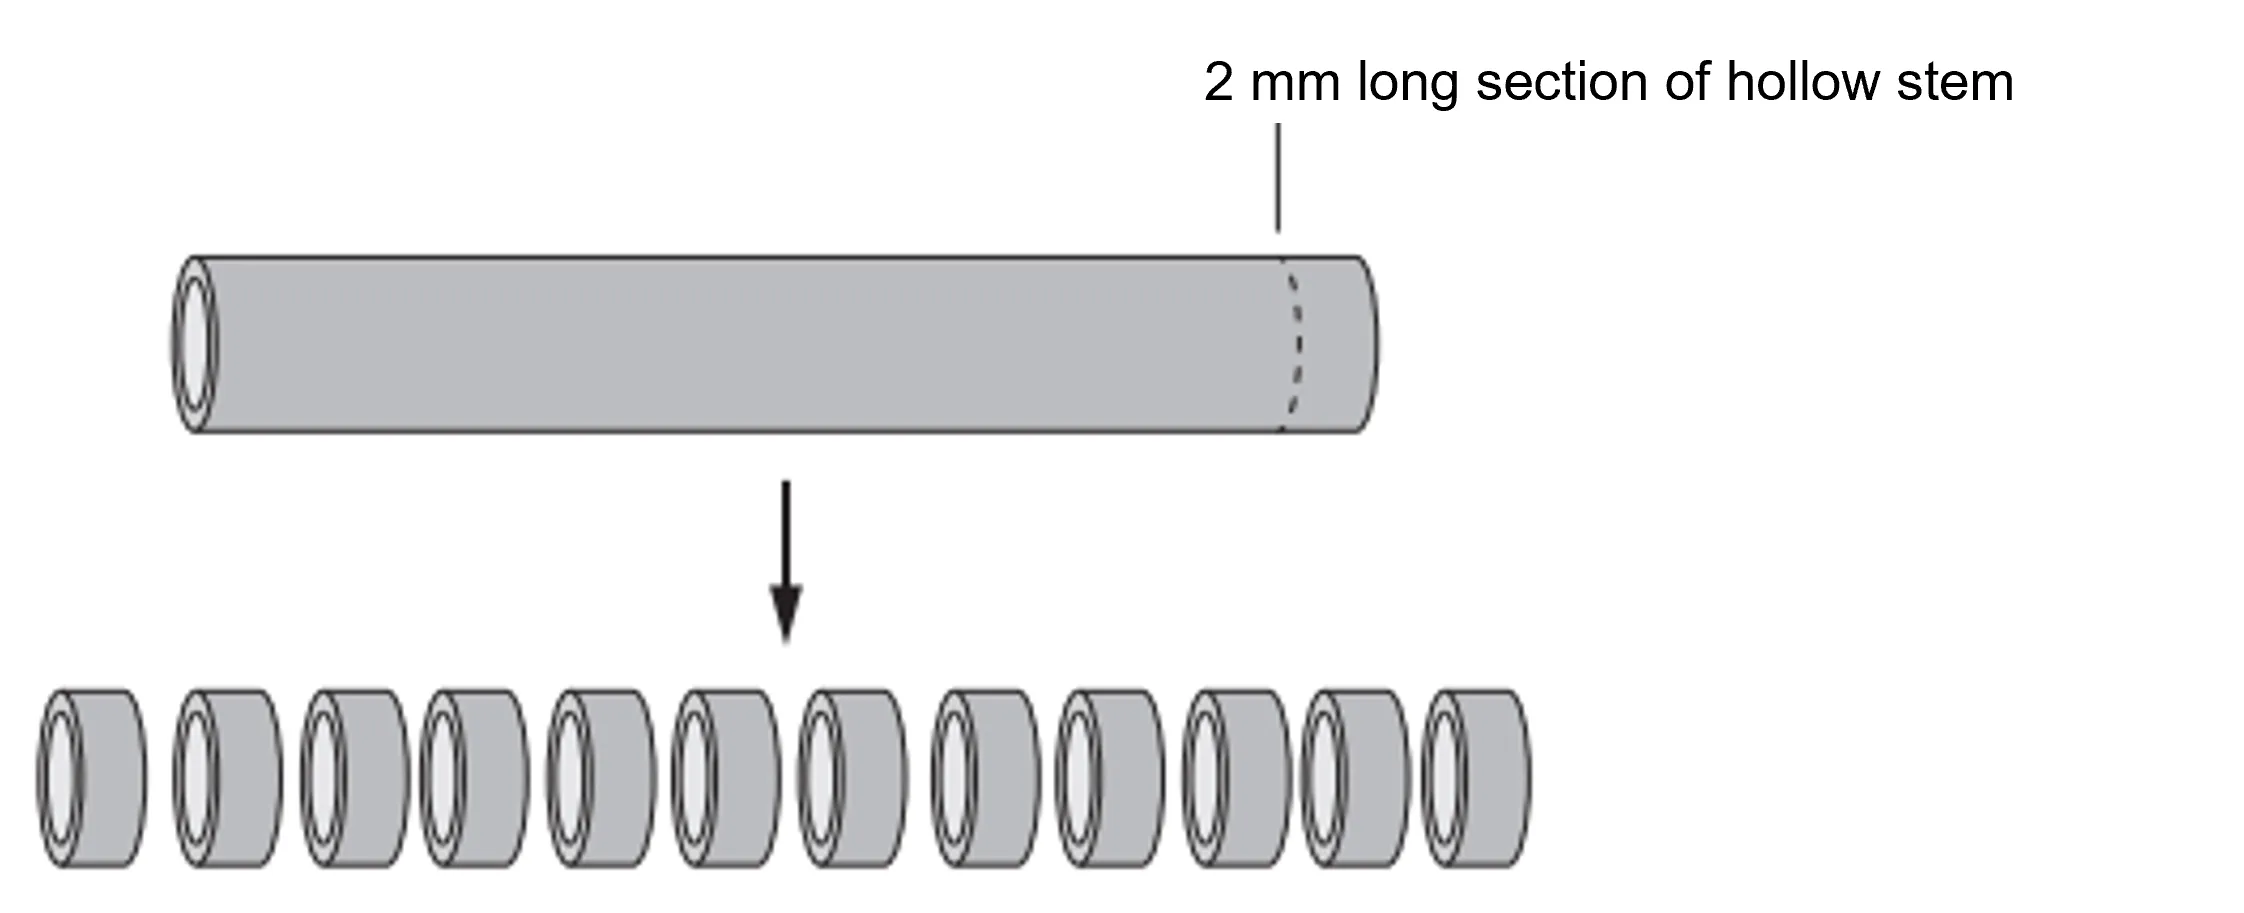
Fig. 1
Step 5 | Each stem ring was then cut open as shown in Fig. 2. |
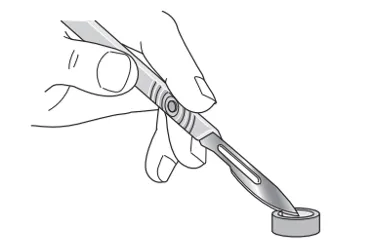
Fig. 2
Step 6 | Three cut stem rings were put into each of the different salt solutions in the labelled Petri dishes and left for 10 minutes. |
Fig. 3 shows the appearance of the cut stem rings after 10 minutes.
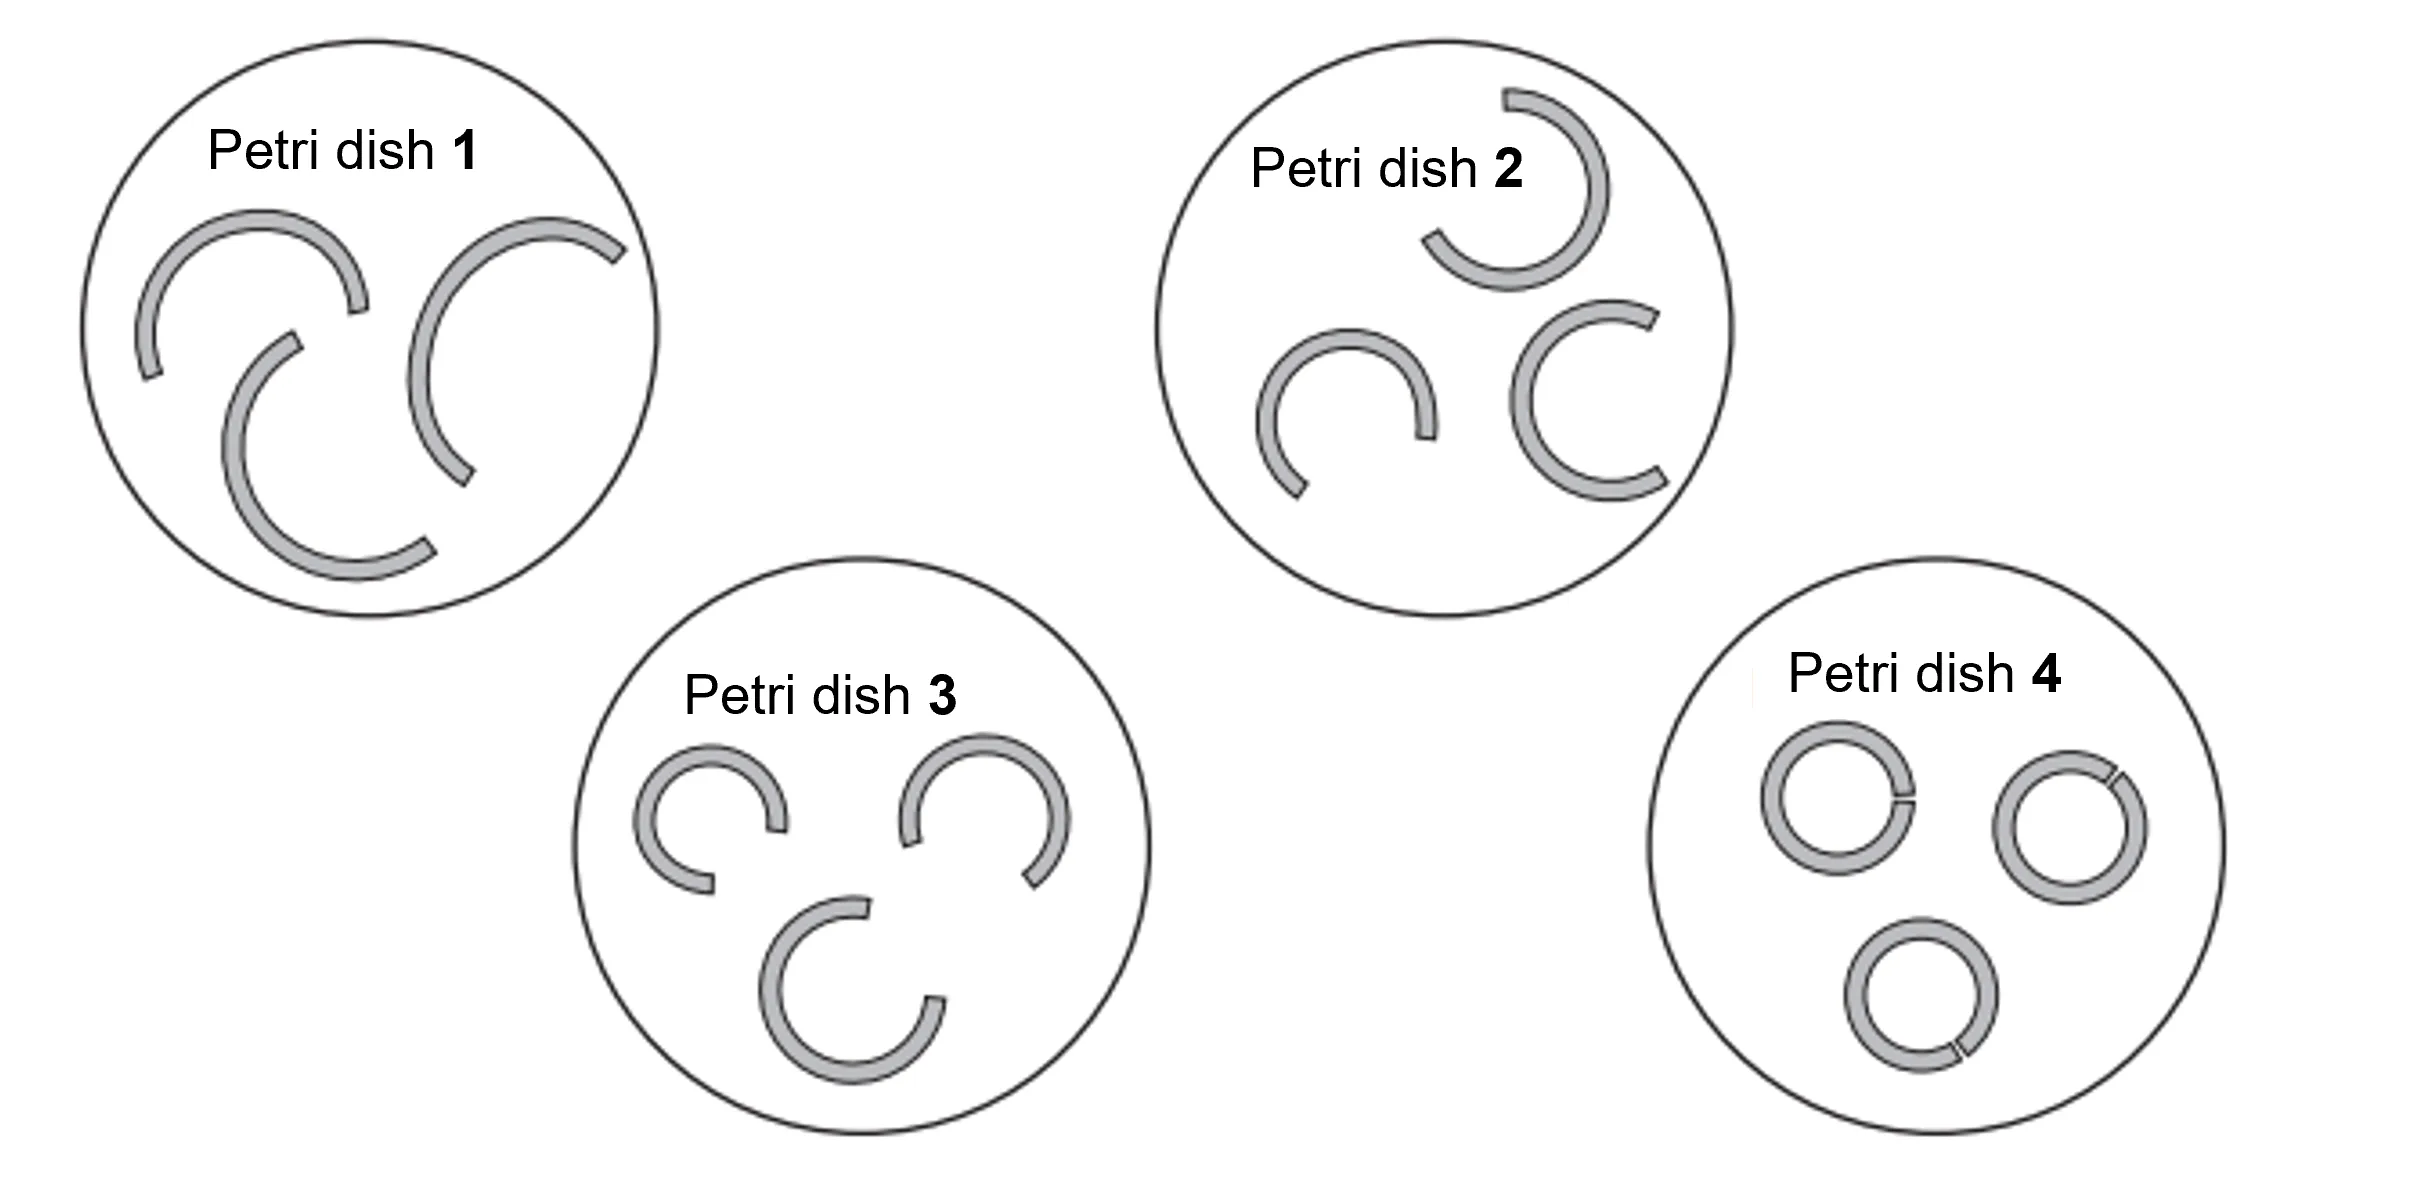
Fig. 3
Step 7 | The distance between the two cut ends of each stem ring can be measured, as shown in Fig. 4 |
In the example shown in Fig. 4 the distance is 12 mm.
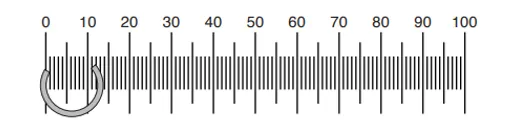
Fig. 4
The measurements of each stem ring were as follows:
Petri dish 1: 18 mm, 20 mm, 17 mm
Petri dish 2: 10 mm, 12 mm, 12 mm
Petri dish 3: 7 mm, 10 mm, 12 mm
Petri dish 4: 1 mm, 1 mm, 1 mm
(ii) Prepare a table and record your measurements in your table.
Your table should show:
all of your results
a calculated average for each solution.
[4]
(iii) Use Table 1 and your measurements to describe the results shown in Fig. 3
[1]
1.2. Identify one hazard in step 4 and describe a suitable safety precaution.
1.3. Explain why more than one ring of the hollow stem was placed into each Petri dish.
1.4. (i) State the variable that was changed (independent variable) in this investigation.
[1]
(ii) Identify two variables that were kept constant in this investigation.
[2]
1.5. There are potential errors in steps 4 and 7.
Identify two of these errors and suggest an improvement for each.
1.6. Fig. 5 shows a section through a hollow plant stem observed through a light microscope.
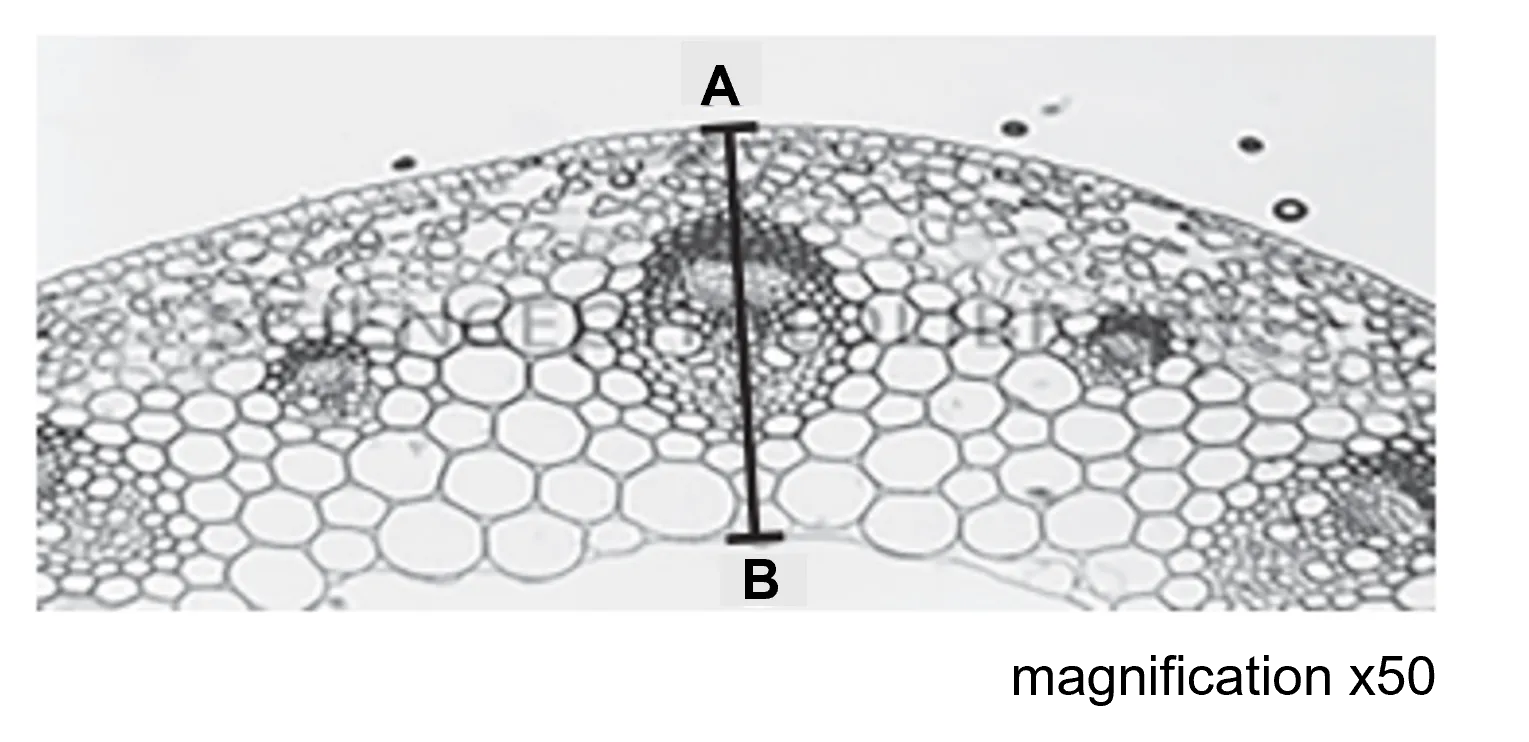
Fig. 5
The measured length of AB on Fig. 5 is 28 mm.
Calculate the actual length of AB using the following equation:
Show your working.

Ai এর মাধ্যমে

১০ লক্ষ+ প্রশ্ন ডাটাবেজ

প্র্যাকটিস এর মাধ্যমে নিজেকে তৈরি করে ফেলো
উত্তর দিবে তোমার বই থেকে ও তোমার মত করে।

সারা দেশের শিক্ষার্থীদের মধ্যে নিজের অবস্থান যাচাই
No related questions found

