Scatter Graphs & Correlation
1. This question has 4 part(s).
1.1. Belle records the height, in centimetres, and the mass, in kilograms, of some goats.
Some of her results are shown in the scatter diagram.
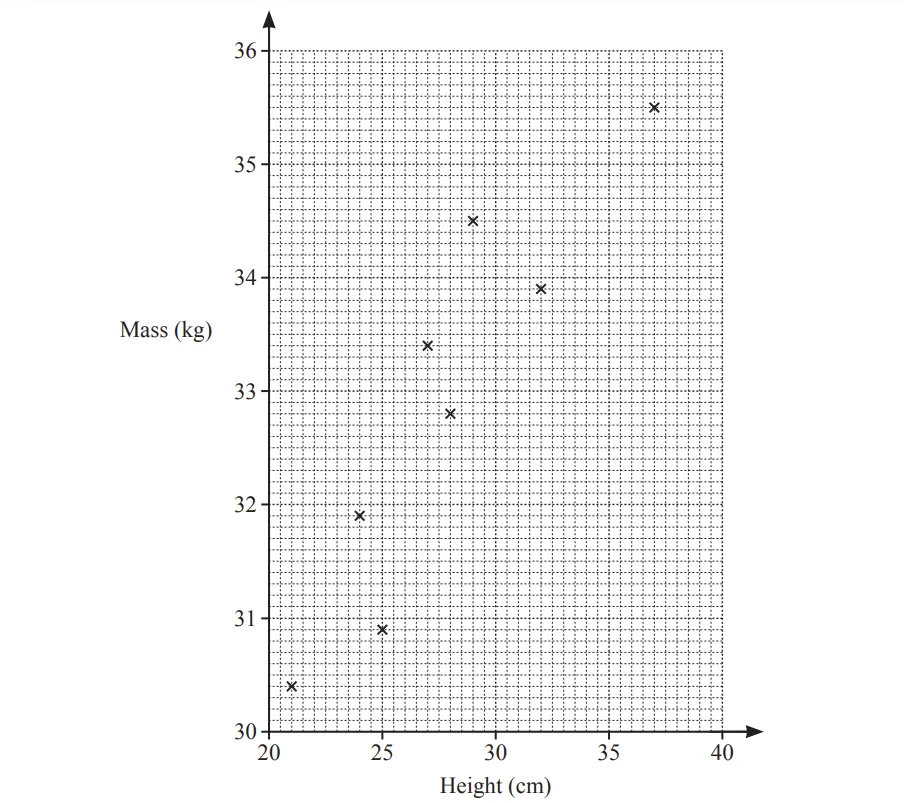
The table shows four more results.
Height (cm) | 23 | 30 | 36 | 38 |
Mass (kg) | 31.2 | 33.5 | 34.6 | 34.8 |
Plot these points on the scatter diagram.
1.2. What type of correlation is shown in this scatter diagram?
1.3. The mean height of all the goats is 29.5 cm and the mean mass is 33.2 kg.
i) Draw a line of best fit on the scatter diagram.
[2]
ii) Use your line of best fit to estimate the height of a goat with mass 32.5kg.
[1]
1.4. Work out the percentage of the 12 goats that have a height between 26cm and 35cm.

Ai এর মাধ্যমে

১০ লক্ষ+ প্রশ্ন ডাটাবেজ

প্র্যাকটিস এর মাধ্যমে নিজেকে তৈরি করে ফেলো
উত্তর দিবে তোমার বই থেকে ও তোমার মত করে।

সারা দেশের শিক্ষার্থীদের মধ্যে নিজের অবস্থান যাচাই
No related questions found

