Histograms
1. This question has 2 part(s).
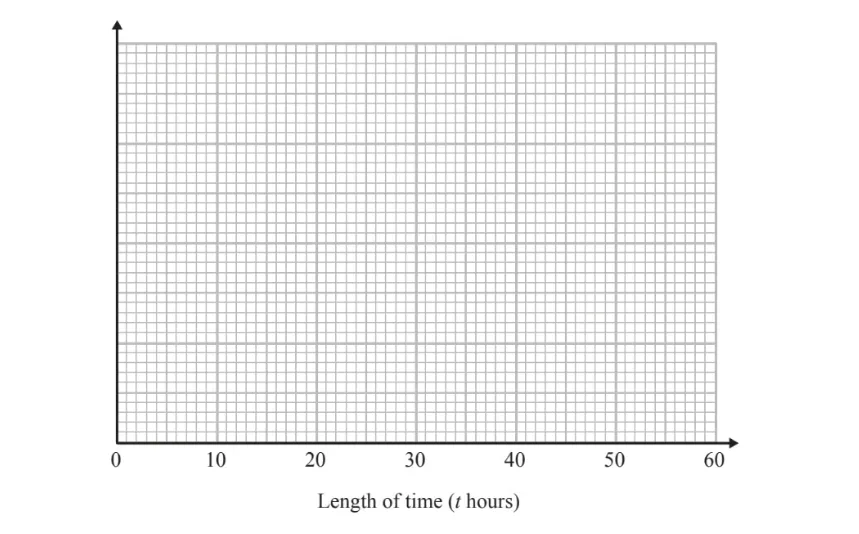
1.1. The table gives some information about the lengths of time, in hours, that some adults watched TV last week.
Length of time( hours) | Frequency |
Work out an estimate for the mean length of time.
1.2. Draw a histogram for the information in the table.

Ai এর মাধ্যমে

১০ লক্ষ+ প্রশ্ন ডাটাবেজ

প্র্যাকটিস এর মাধ্যমে নিজেকে তৈরি করে ফেলো
উত্তর দিবে তোমার বই থেকে ও তোমার মত করে।

সারা দেশের শিক্ষার্থীদের মধ্যে নিজের অবস্থান যাচাই
No related questions found

