1.4 Production Possibility Curve (PPC) Diagrams
1. The diagram shows the production possibility curve (PPC) of a country producing at point T.
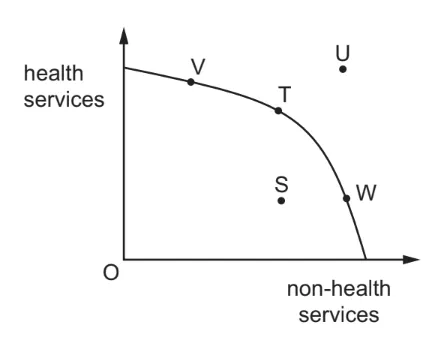
The country has an ageing population and decides to allocate more resources to the production of health services. Which movement shows this change in resource allocation?

Ai এর মাধ্যমে

১০ লক্ষ+ প্রশ্ন ডাটাবেজ

প্র্যাকটিস এর মাধ্যমে নিজেকে তৈরি করে ফেলো
উত্তর দিবে তোমার বই থেকে ও তোমার মত করে।

সারা দেশের শিক্ষার্থীদের মধ্যে নিজের অবস্থান যাচাই
No related questions found

