Cumulative Frequency & Box Plots
1. This question has 3 part(s).
1.1. The box plot shows information about the distribution of the amounts of money spent by some male students on their holidays.
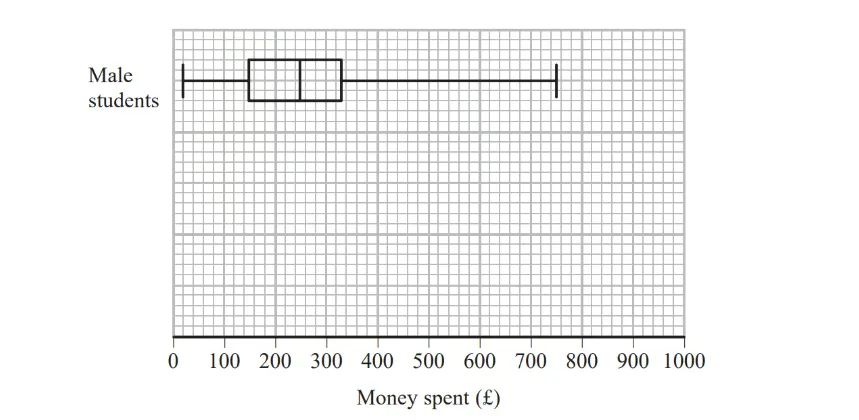
Work out the interquartile range for the amounts of money spent by these male students.
1.2. The table below shows information about the distribution of the amounts of money spent by some female students on their holidays.
Smallest | Lower quartile | Median | Upper quartile | Largest | |
Money spent (£) | 60 | 180 | 300 | 350 | 650 |
On the grid above, draw a box plot for the information in the table.
1.3. Chris says, "The box plots show that the female students spent more money than the male students."
Is Chris correct? Give a reason for your answer.

Ai এর মাধ্যমে

১০ লক্ষ+ প্রশ্ন ডাটাবেজ

প্র্যাকটিস এর মাধ্যমে নিজেকে তৈরি করে ফেলো
উত্তর দিবে তোমার বই থেকে ও তোমার মত করে।

সারা দেশের শিক্ষার্থীদের মধ্যে নিজের অবস্থান যাচাই
No related questions found

