Modelling involving Numerical Methods
1. This question has 3 part(s).
1.1. Scientists are analysing the infection rate, R, at which a virus Divid-e20 spreads amongst a population.They model R using the function
where t is the number of months since the first case of the virus was discovered.
To control the spread of Divid-e20 scientists need to keep the value of R below 1.
The diagram below shows the graphs of and .
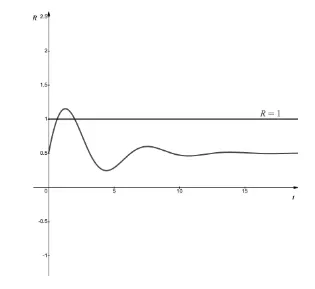
Use the Newton-Raphson method, with a suitable initial value, to find the number of months after Divid-e20 was discovered that R first equals 1. Give your answer to three decimal places.
1.2. Given that the infection rate for Divid-e20 first went above 1 on 1st July, and drops back below 1 roughly 1.997 months (to three decimal places) after Divid-e20 was first discovered, work out the date when the infection rate drops back below 1.
1.3. In the long term, scientists expect the value of R to remain roughly constant around 0.5. Briefly explain how you can tell this from the function R(t).

Ai এর মাধ্যমে

১০ লক্ষ+ প্রশ্ন ডাটাবেজ

প্র্যাকটিস এর মাধ্যমে নিজেকে তৈরি করে ফেলো
উত্তর দিবে তোমার বই থেকে ও তোমার মত করে।

সারা দেশের শিক্ষার্থীদের মধ্যে নিজের অবস্থান যাচাই
No related questions found

