Simple Probability Diagrams
1. This question has 2 part(s).
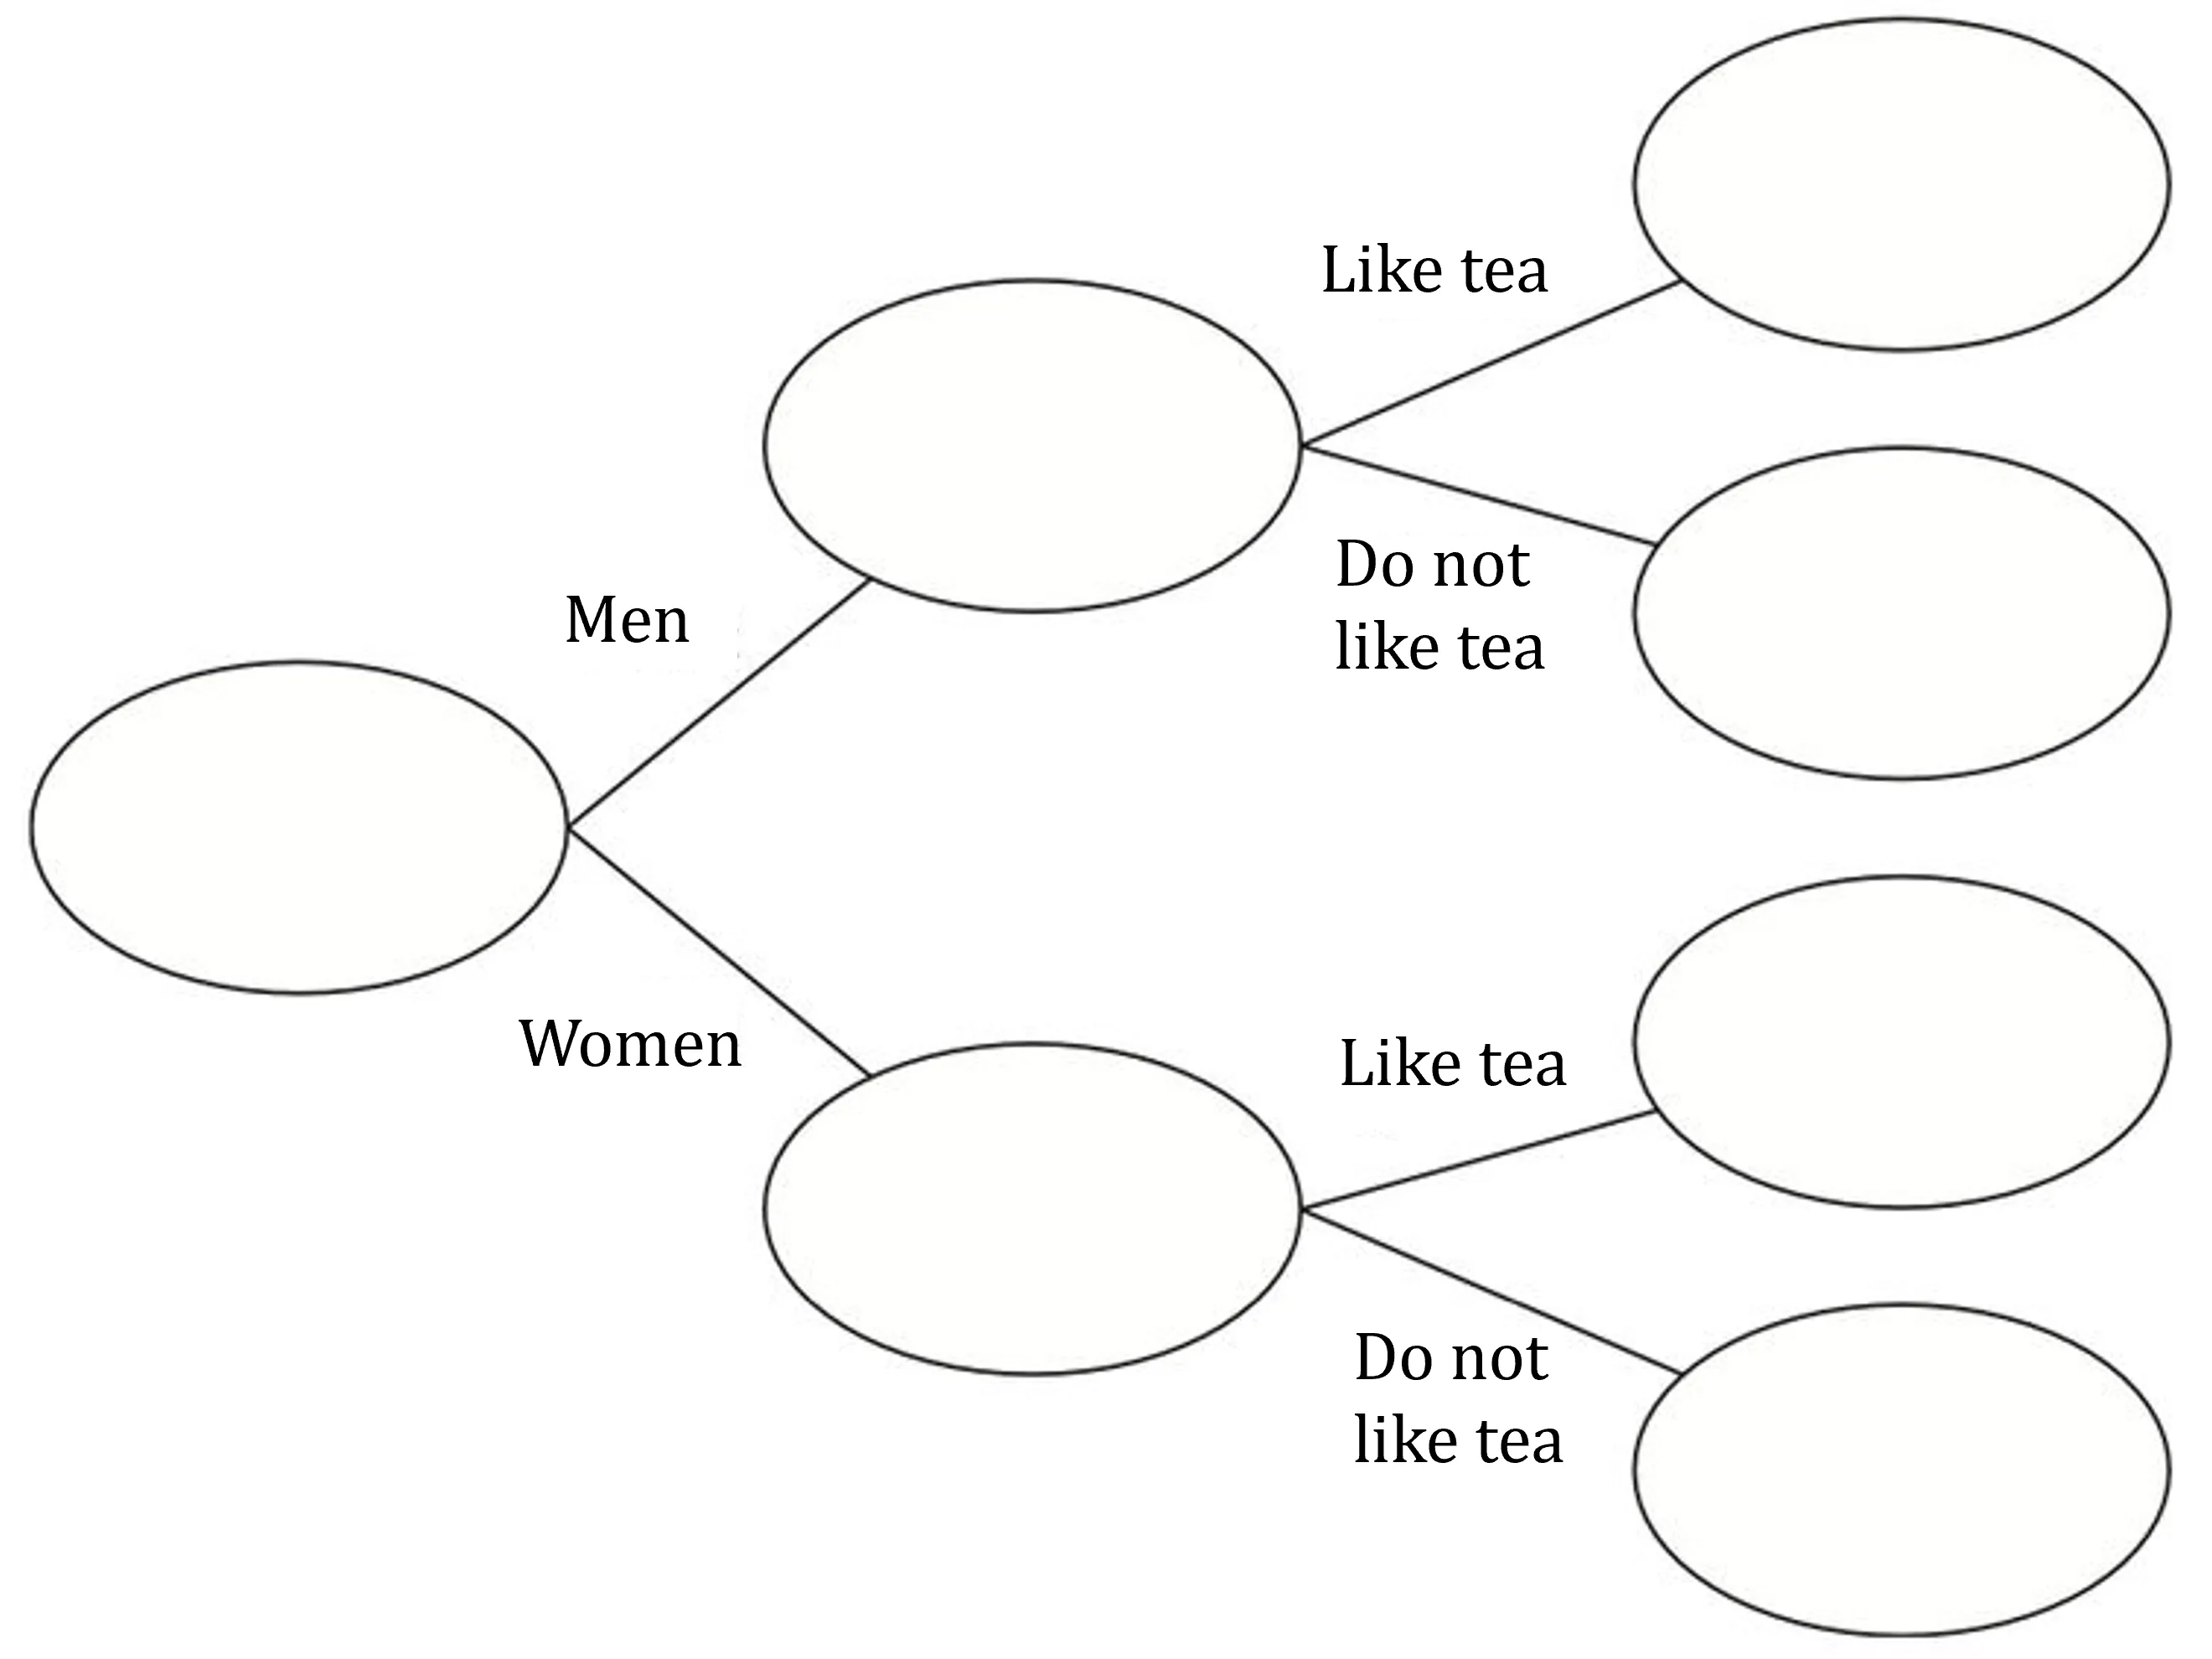
1.1. A survey is taken in an office to see how many staff like to drink tea.
70 staff are asked in total.
42 of these people are women.
49 of the 70 staff like to drink tea.
10 of the men do not like to drink tea.
Use this information to complete the frequency tree.
1.2. One of the people who like to drink tea is chosen at random.
Find the probability that this person is a woman.

Ai এর মাধ্যমে

১০ লক্ষ+ প্রশ্ন ডাটাবেজ

প্র্যাকটিস এর মাধ্যমে নিজেকে তৈরি করে ফেলো
উত্তর দিবে তোমার বই থেকে ও তোমার মত করে।

সারা দেশের শিক্ষার্থীদের মধ্যে নিজের অবস্থান যাচাই
No related questions found

