1.1 Cells & Movement Across Membranes
1. The following experiment was used to study the movement of water in and out of cells.
A glass thistle funnel was half filled with sucrose solution.
The bottom of the thistle funnel was closed by a selectively permeable membrane.
The thistle funnel was placed in a beaker containing distilled water. As shown in Image 5.1.
The level of sucrose solution in the glass tube was marked.
The apparatus was left for 30 minutes and then the level of the sucrose solution in the glass tube was measured.
The distance the sucrose solution had moved was calculated.
If the level of the sucrose solution went up, the number was recorded as a positive number, but if the level of the sucrose solution went down, the number was recorded as a negative number.
The experiment was repeated by placing the thistle funnel in salt solutions of 0.2, 0.3, 0.6 and 0.8mol/dm3 .
Image 5.1
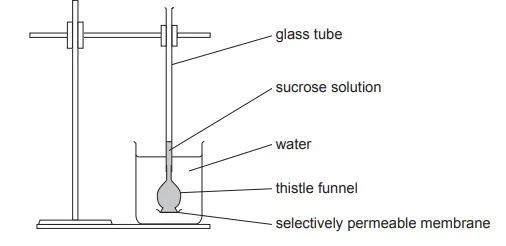
The results of the experiment are shown in Table 5.2.
Table 5.2
Salt concentration (mol/dm3 ) | Change in level of the sucrose solution in tube (mm) |
0.0 (distilled water) | +36 |
0.2 | +23 |
0.3 | –7 |
0.6 | –17 |
0.8 | –23 |
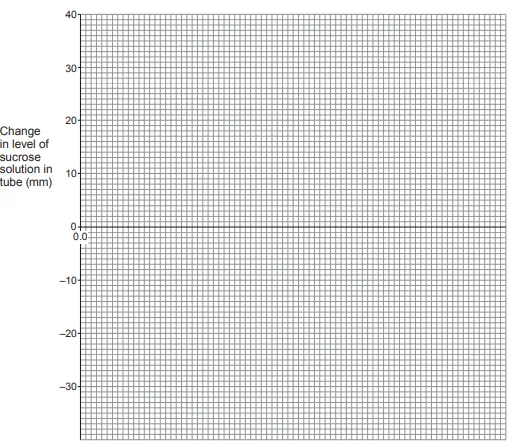
Use the results from Table 5.2 to produce a line graph on Graph 5.3 below. The scale and label for the y axis have been completed for you, along with the origin for the x axis
Graph 5.3

Ai এর মাধ্যমে

১০ লক্ষ+ প্রশ্ন ডাটাবেজ

প্র্যাকটিস এর মাধ্যমে নিজেকে তৈরি করে ফেলো
উত্তর দিবে তোমার বই থেকে ও তোমার মত করে।

সারা দেশের শিক্ষার্থীদের মধ্যে নিজের অবস্থান যাচাই
No related questions found

