Graphs in Kinematics
1. This question has 2 part(s).
1.1. A tram pulls away from stop A, accelerating uniformly from rest to 20 ms−1 in 10 seconds.
It then travels at this constant speed for another 30 s.
During the final 20 s of the trip it decelerates uniformly to rest at stop B.
The velocity–time graph for the journey is shown in Figure 1.
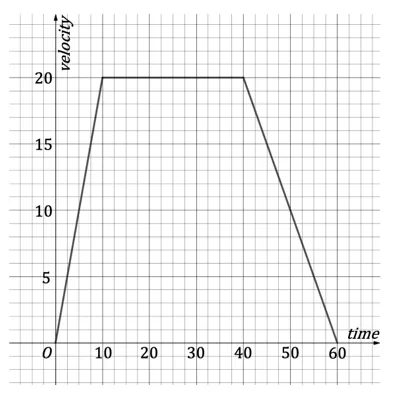
Find the distance between stop A and stop B.
1.2. Determine the magnitude of the tram’s deceleration during the last 20 s of its motion.

Ai এর মাধ্যমে

১০ লক্ষ+ প্রশ্ন ডাটাবেজ

প্র্যাকটিস এর মাধ্যমে নিজেকে তৈরি করে ফেলো
উত্তর দিবে তোমার বই থেকে ও তোমার মত করে।

সারা দেশের শিক্ষার্থীদের মধ্যে নিজের অবস্থান যাচাই
No related questions found

