Climate Change & Glaciated Landscapes
1. This question has 3 part(s).
1.1. Study Figure 2a below which shows data collected about the surface area of nine European glaciers in 1977 and 1995.
A t-test can establish if there is a significant difference between the two datasets.
Surface area of 9 glaciers in 1977 | Surface area of 9 glaciers in 1995 | |
|---|---|---|
Mean glacier size | 7.3 | 3.8 |
Standard deviation | 1.5 | 1.7 |
Figure 2a
Using the partially completed Student’s t-test below, calculate the value of t.
Give your answer to 1 decimal place.
t = ...............................................
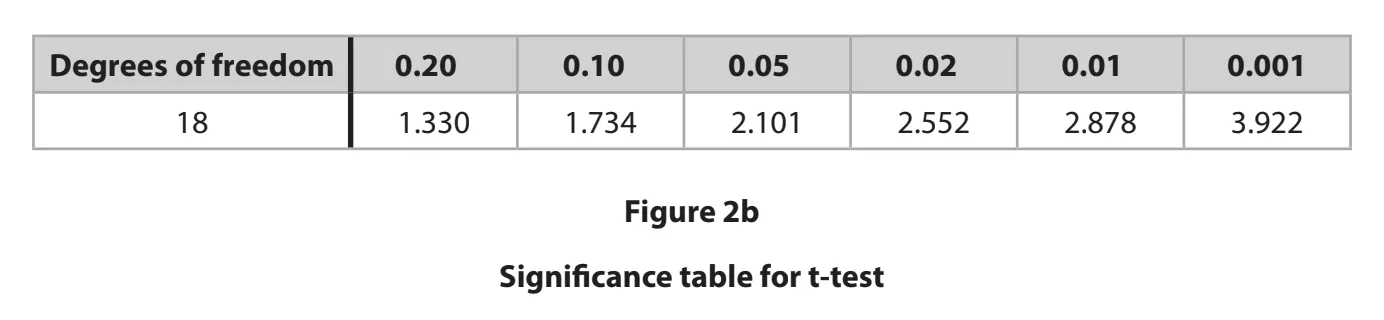
1.2. Identify the significance level of your t-test result using Figure 2b
1.3. Suggest one reason for the change in size of glaciers between 1977 and 1995.

Ai এর মাধ্যমে

১০ লক্ষ+ প্রশ্ন ডাটাবেজ

প্র্যাকটিস এর মাধ্যমে নিজেকে তৈরি করে ফেলো
উত্তর দিবে তোমার বই থেকে ও তোমার মত করে।

সারা দেশের শিক্ষার্থীদের মধ্যে নিজের অবস্থান যাচাই
No related questions found

