Measures of Dispersion
1. This question has 4 part(s).
1.1. Sam used the internet to collect the times, in minutes, it took for 50 cyclists to compete in a hill climb competition. He used a group frequency table to record the results he collected.
(i) Give one advantage of using grouped data rather than raw data.
[1]
(ii) Give one disadvantage of using grouped data rather than raw data.
[1]
1.2. Sam used this grouped frequency table to show the results for the hill climb.
Time (t minutes) | Frequency |
| 2 |
| 25 |
| 15 |
| 4 |
| 1 |
| 1 |
| 1 |
(Source: cyclinguphill.com)
Before Sam collected the data he did not know what the longest time would be. The longest time in the hill climb was 28.3 minutes.
Explain why this table cannot be used to show the data for all 50 riders.
1.3. Sam drew this frequency polygon for the hill climb results.
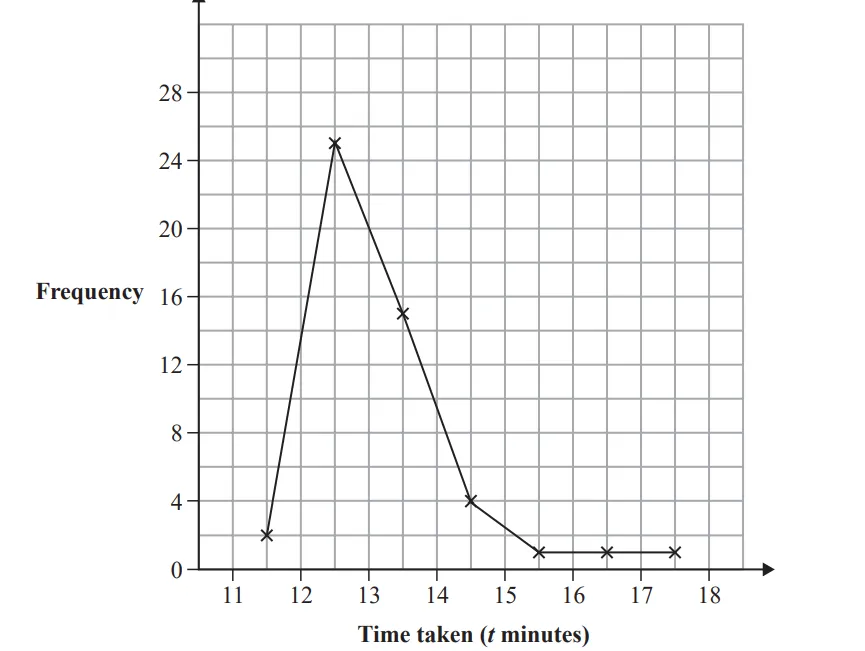
Sam decided not to include the value of 28.3 minutes on his frequency polygon.
Suggest a reason why Sam’s decision might be appropriate.
1.4. (i) Describe the skew of the distribution
[1]
(ii) Interpret the skew of the distribution in context.
[1]

Ai এর মাধ্যমে

১০ লক্ষ+ প্রশ্ন ডাটাবেজ

প্র্যাকটিস এর মাধ্যমে নিজেকে তৈরি করে ফেলো
উত্তর দিবে তোমার বই থেকে ও তোমার মত করে।

সারা দেশের শিক্ষার্থীদের মধ্যে নিজের অবস্থান যাচাই
No related questions found

