Modelling with Logarithms & Exponentials
1. This question has 2 part(s).
1.1. An exponential growth model for the number of bacteria in an experiment is of the form
is the number of bacteria and is the time in hours since the experiment began. and are constants.
A scientist records the number of bacteria at various points over a six-hour period. The results are in the table below.
, hours | 0 | 1.5 | 3 | 4.5 | 6 |
, no. of bacteria | 120 | 190 | 360 | 680 | 1230 |
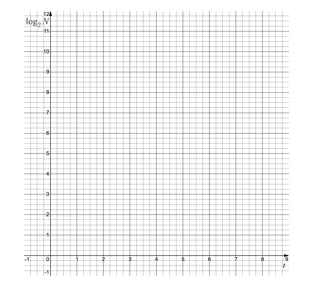
By plotting against , drawing a line of best fit and finding its equation, estimate the values of , , and .
1.2. What does the model predict for the value of after twelve hours? Comment on the reliability of this prediction.

Ai এর মাধ্যমে

১০ লক্ষ+ প্রশ্ন ডাটাবেজ

প্র্যাকটিস এর মাধ্যমে নিজেকে তৈরি করে ফেলো
উত্তর দিবে তোমার বই থেকে ও তোমার মত করে।

সারা দেশের শিক্ষার্থীদের মধ্যে নিজের অবস্থান যাচাই
No related questions found

