Urban Issues & Challenges
1. This question has 2 part(s).
1.1. Study Figure 1, a graph showing the percentage of the population living in urban areas in different parts of the world 1950–2050 (projected).
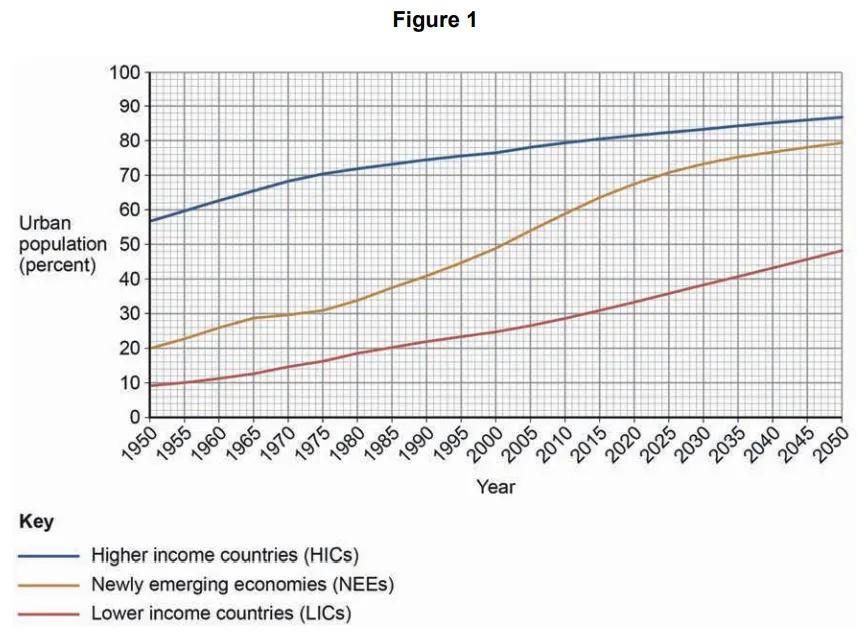
Complete the following paragraph to describe the changes shown in Figure 1.
Choose the three correct answers from this list:
HICs | doubled | NEEs |
slow down | trebled | speed up |
The smallest increase in percentage of urban population 1950–2050 is expected to be in _____.
From 2020, the rate of increase is expected to ______ in NEEs.
Between 2000 and 2050, lower-income countries are projected to have almost _____ in the percentage living in urban areas.
1.2. Outline one reason why rates of natural increase are high in many cities in LIC/NEEs.

Ai এর মাধ্যমে

১০ লক্ষ+ প্রশ্ন ডাটাবেজ

প্র্যাকটিস এর মাধ্যমে নিজেকে তৈরি করে ফেলো
উত্তর দিবে তোমার বই থেকে ও তোমার মত করে।

সারা দেশের শিক্ষার্থীদের মধ্যে নিজের অবস্থান যাচাই
No related questions found

