1.4 Production Possibility Curve (PPC) Diagrams
1. The diagram shows the production possibility curve (PPC) for an economy.
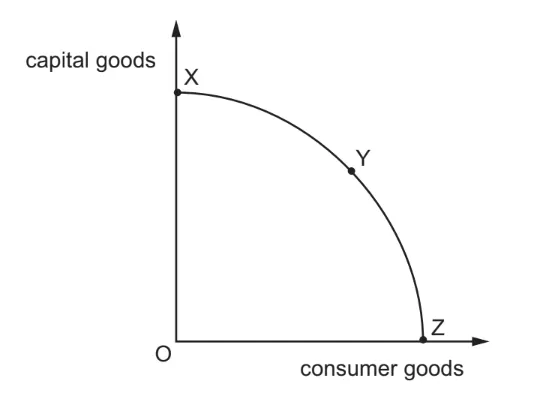
What will happen to the opportunity cost of producing more units of consumer goods in terms of capital goods as the economy moves down its PPC from point X to point Z?

Ai এর মাধ্যমে

১০ লক্ষ+ প্রশ্ন ডাটাবেজ

প্র্যাকটিস এর মাধ্যমে নিজেকে তৈরি করে ফেলো
উত্তর দিবে তোমার বই থেকে ও তোমার মত করে।

সারা দেশের শিক্ষার্থীদের মধ্যে নিজের অবস্থান যাচাই
No related questions found

