Capacitor Charge & Discharge
1. This question has 4 part(s).
1.1. Isabelle won a national physics competition for an idea she developed, which involves measuring the intensity of light using capacitors and data loggers.
The circuit she designed consists of a photovoltaic cell, P which can generate a potential difference proportional to the intensity of light incident on it. This is connected to a capacitor C, a switch S and a data logger, shown in Figure 1 below:
Figure 1
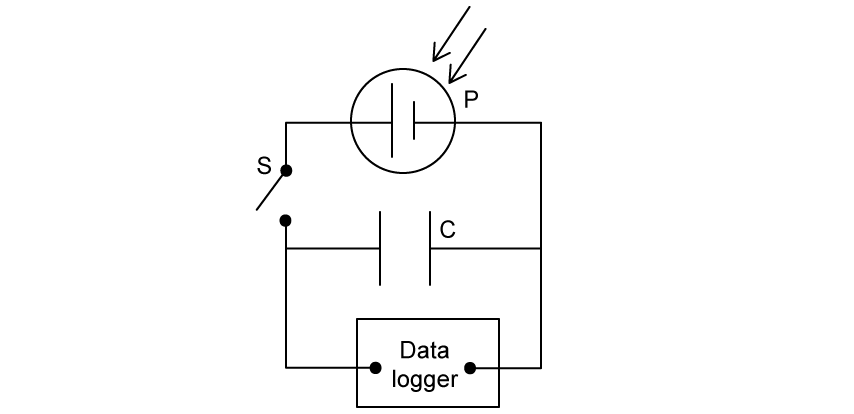
Explain why the data logger is connected in parallel across the capacitor C.
1.2. Isabelle’s experiment involved printing measurements from the data logger as shown in Table 1 below.
Table 1
Time / s | p.d. / mV | ln (p.d. / mV) |
0 | 100 | 4.6 |
20 | 70 | 4.2 |
40 | 48 | 3.9 |
60 | 35 | |
80 | 24 | |
100 | 18 |
Some of the data is not shown in Table 1.
(i) Complete the missing data in Table 1
(ii) Plot the data from Table 1 on the graph below and draw an appropriate line of best fit
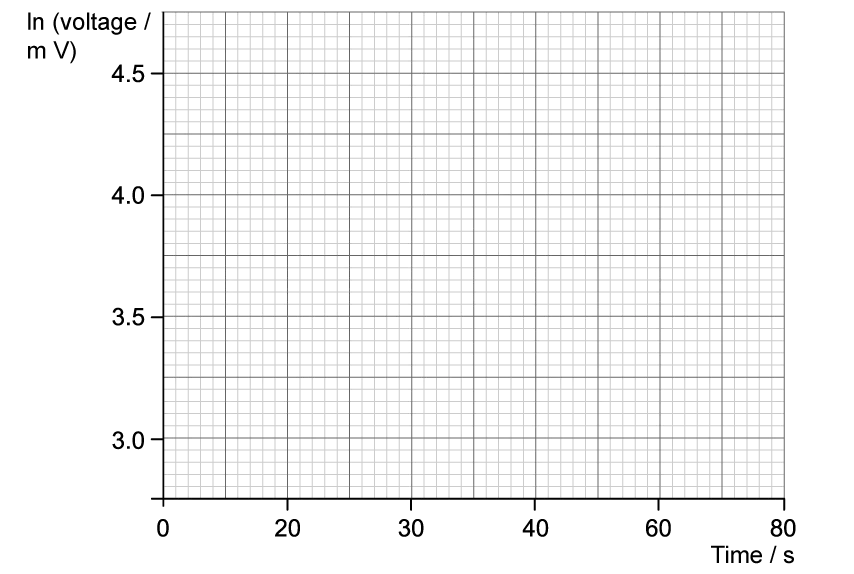
1.3. Isabelle’s report included a detailed description of how a graph of the data could be used to verify the capacitance of the capacitor C.
She proposed the equation of the line as:
ln V = – t + ln
and stated that the quantity RC is known as the time constant of the capacitor.
(i) State the unit of the quantity RC
(ii) State the meaning of the quantity represented by
1.4. Isabelle demonstrated that the gradient of the line she obtained had a value of 0.0165.
Use the value of Isabelle’s gradient, and the equation of the line in part (c), to calculate the time constant of the capacitor.

Ai এর মাধ্যমে

১০ লক্ষ+ প্রশ্ন ডাটাবেজ

প্র্যাকটিস এর মাধ্যমে নিজেকে তৈরি করে ফেলো
উত্তর দিবে তোমার বই থেকে ও তোমার মত করে।

সারা দেশের শিক্ষার্থীদের মধ্যে নিজের অবস্থান যাচাই
No related questions found

