Histograms
1. The histogram and the table give some information about the amounts of time, in hours, that Year 11 students at Bergdesh Academy spent, in total, on their homework last week.
No student in Year 11 spent longer than 9 hours on their homework.
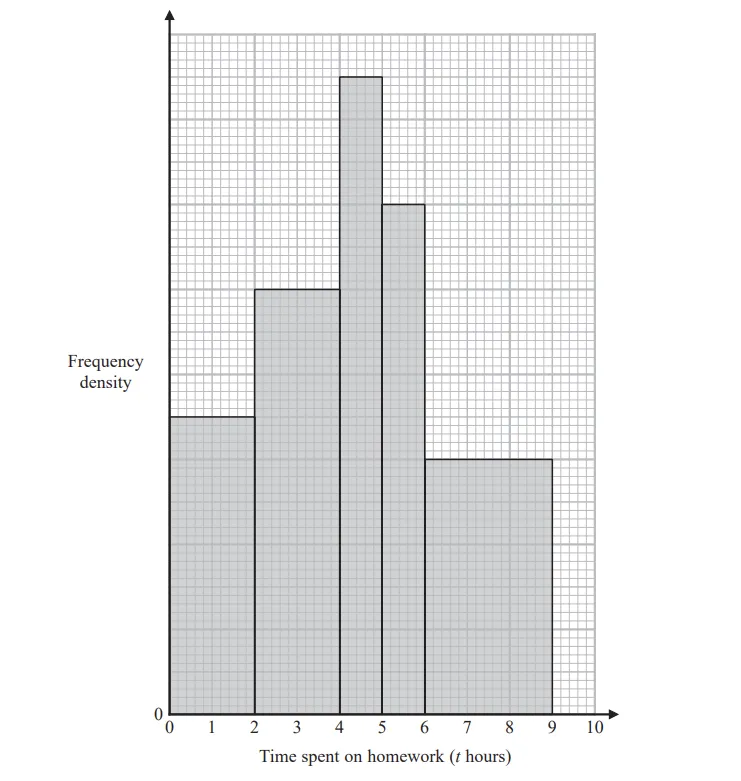
Time spent on homework (t hours) | Frequency |
\(0 | 28 |
\(2 | |
\(4 | |
\(5 | |
\(6 |
Using the information in the histogram and in the table, work out an estimate for the mean amount of time the Year 11 students spent on their homework last week.
Give your answer in hours correct to 3 significant figures.
...................................................... hours

Ai এর মাধ্যমে

১০ লক্ষ+ প্রশ্ন ডাটাবেজ

প্র্যাকটিস এর মাধ্যমে নিজেকে তৈরি করে ফেলো
উত্তর দিবে তোমার বই থেকে ও তোমার মত করে।

সারা দেশের শিক্ষার্থীদের মধ্যে নিজের অবস্থান যাচাই
No related questions found

