Statistical Diagrams
1. This question has 2 part(s).
1.1. Fran asks each of 40 students how many books they bought last year.
The chart below shows information about the number of books bought by each of the 40 students.
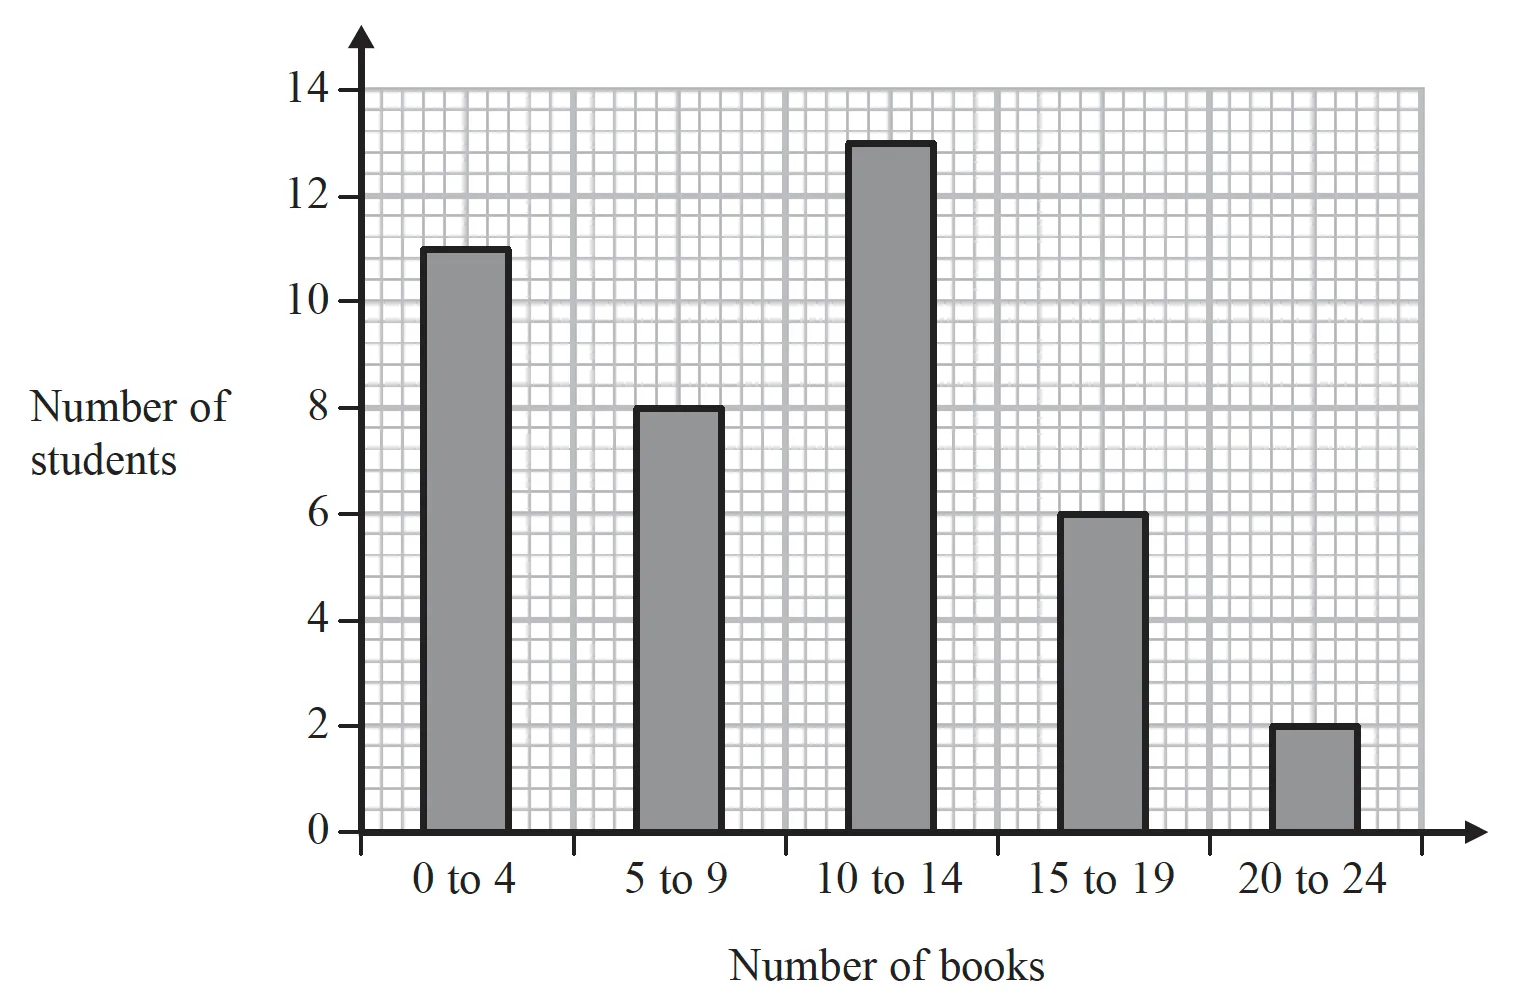
Work out the percentage of these students who bought 20 or more books.
...........%
1.2. Show that an estimate for the mean number of books bought is 9.5 You must show all your working.

Ai এর মাধ্যমে

১০ লক্ষ+ প্রশ্ন ডাটাবেজ

প্র্যাকটিস এর মাধ্যমে নিজেকে তৈরি করে ফেলো
উত্তর দিবে তোমার বই থেকে ও তোমার মত করে।

সারা দেশের শিক্ষার্থীদের মধ্যে নিজের অবস্থান যাচাই
No related questions found

