Practical Skills: Written Assessment
1. This question has 6 part(s).
1.1. The effect of wave action on the height of the shells of the dog whelk (Nucella lapillus) was investigated by comparing an exposed shore and a sheltered shore.
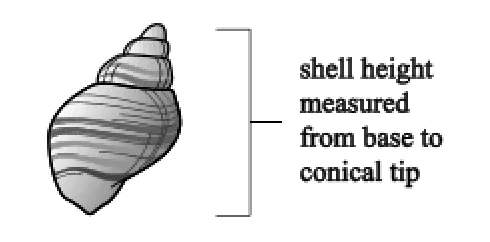
A random sampling technique was used to collect 50 shells from an exposed shore.
The shell height was measured from the base to the conical tip. The whelk was returned to its location.
The process was repeated for the sheltered shore.
All the results were recorded in Table 3.1.
Location | Height of shell (mm) | Range | Mean | SD | ||||||||
Sheltered shore | 26 | 28 | 27 | 26 | 28 | 23 | 28 | 23 | 26 | 28 | ||
29 | 29 | 29 | 29 | 29 | 28 | 29 | 29 | 29 | 29 | |||
30 | 31 | 30 | 29 | 32 | 29 | 30 | 29 | 30 | 32 | |||
33 | 35 | 34 | 32 | 35 | 32 | 34 | 32 | 33 | 35 | |||
37 | 39 | 38 | 37 | 39 | 35 | 38 | 36 | 37 | 39 | 16 | 31.3 | 4.1 |
Exposed shore | 15 | 17 | 16 | 15 | 23 | 15 | 23 | 16 | 13 | 15 | ||
17 | 24 | 18 | 17 | 17 | 14 | 17 | 18 | 16 | 17 | |||
19 | 19 | 20 | 24 | 18 | 20 | 19 | 20 | 18 | 20 | |||
23 | 14 | 24 | 14 | 21 | 20 | 23 | 17 | 21 | 23 | |||
25 | 25 | 28 | 26 | 25 | 27 | 25 | 28 | 25 | 27 | 15 | 20.0 | 4.2 |
Table 3.1
The t test can be used to determine the significance of the differences between shell height on the exposed shore and the sheltered shore.
(i) Calculate the t value for the data using the formula:
where,
is the difference in mean values of sample 1 and sample 2
and are the squares of the standard deviations of the samples
n1 and n2 are the sample sizes.
Give your answer to two decimal places.
[2]
(ii) The null hypothesis is that there is no difference between the means of the two shell populations.
The critical values at 98 degrees of freedom are shown in Table 3.2.
Degrees of freedom | p = 0.10 | p = 0.05 | p = 0.01 | p = 0.001 |
98 | 1.67 | 2.00 | 2.64 | 3.41 |
Table 3.2
Using the table of critical values, explain whether the student would be able to accept or reject the null hypothesis as a result of the t value you calculated in part (i).
[1]
1.2. The students organised the data from Table 3.1 into classes. The organised data is shown in Table 3.3.
Sheltered shore | Exposed shore | ||||
Height (mm) | Tally | Total | Height (mm) | Tally | Total |
23–26 | 5 | 11–14 | 4 | ||
27–30 | 22 | 15–18 | 7 | ||
31–34 | 11 | 19–22 | 12 | ||
35–38 | 9 | 23–26 | 12 | ||
39–42 | 3 | 27–30 | 4 |
Plot the most suitable graph of the data given in Table 3.3.

1.3. Use the data and graph to discuss any correlation between the height of the whelk shell and the type of shore. Suggest explanations for your findings.
1.4. Suggest a limitation of the procedure used to gather the data in this experiment and recommend how you could improve this.
1.5. How could the students improve the accuracy of their data?
1.6. Discuss the validity of the conclusions you have made during this experiment.

Ai এর মাধ্যমে

১০ লক্ষ+ প্রশ্ন ডাটাবেজ

প্র্যাকটিস এর মাধ্যমে নিজেকে তৈরি করে ফেলো
উত্তর দিবে তোমার বই থেকে ও তোমার মত করে।

সারা দেশের শিক্ষার্থীদের মধ্যে নিজের অবস্থান যাচাই
No related questions found

