Scatter Graphs & Correlation
1. This question has 4 part(s).
1.1. The scatter diagram shows the value, in thousands of dollars, of eight houses in 1996 and the value of the same houses in 2016.
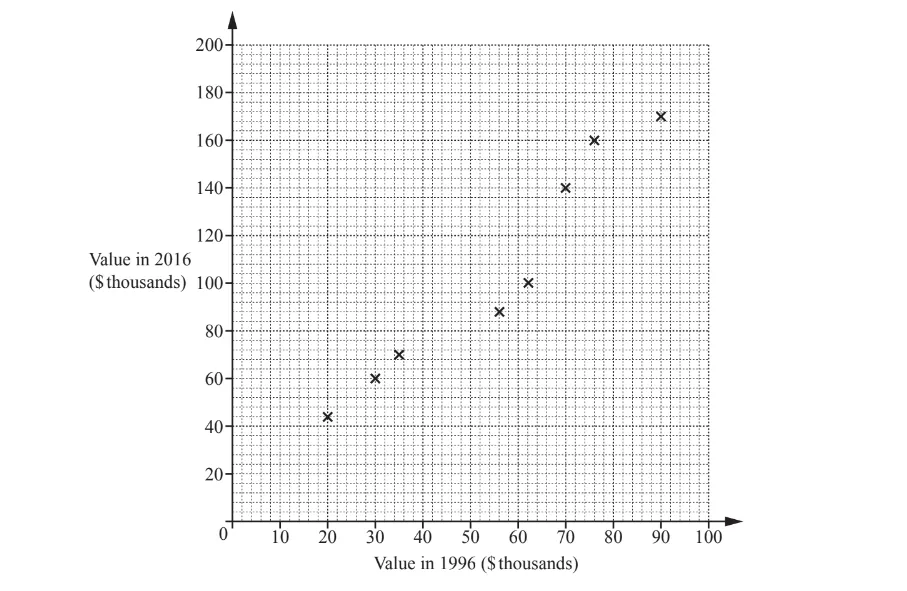
One of these eight houses had a value of $70000 in 1996.
Write down the value of this house in 2016.
$ .................................
1.2. The values of two more houses are shown in the table.
Value in 1996 ($ thousands) | 40 | 80 |
Value in 2016 ($ thousands) | 80 | 150 |
On the scatter diagram, plot these values.
1.3. The first eight houses, already plotted on the scatter diagram, had a total value of $437,000 in 1996 and a mean value of $104,000 in 2016.
On the scatter diagram, draw a line of best fit.
1.4. Another house had a value of $50000 in 1996.
Find an estimate of the value of this house in 2016.
$ ...............................

Ai এর মাধ্যমে

১০ লক্ষ+ প্রশ্ন ডাটাবেজ

প্র্যাকটিস এর মাধ্যমে নিজেকে তৈরি করে ফেলো
উত্তর দিবে তোমার বই থেকে ও তোমার মত করে।

সারা দেশের শিক্ষার্থীদের মধ্যে নিজের অবস্থান যাচাই
No related questions found

