The Heart
1. The graph shows the pressure in different parts of the heart during one cardiac cycle
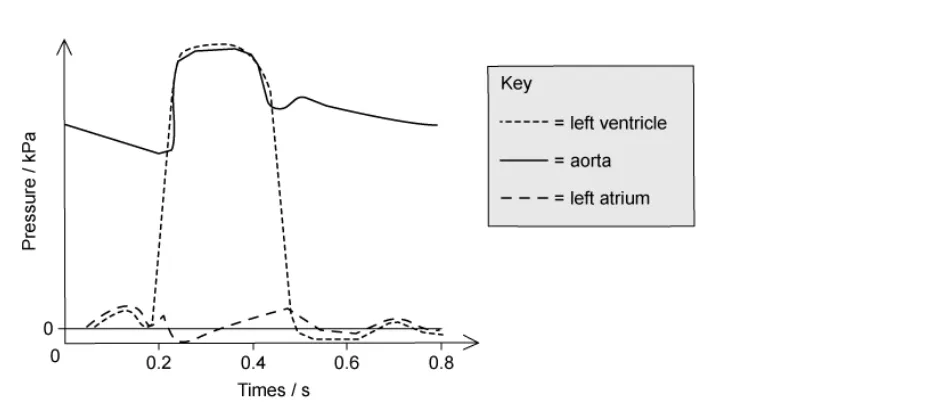
At 0.2 seconds which part of the heart is responding to the excitatory stimulus?

Ai এর মাধ্যমে

১০ লক্ষ+ প্রশ্ন ডাটাবেজ

প্র্যাকটিস এর মাধ্যমে নিজেকে তৈরি করে ফেলো
উত্তর দিবে তোমার বই থেকে ও তোমার মত করে।

সারা দেশের শিক্ষার্থীদের মধ্যে নিজের অবস্থান যাচাই
The table shows some changing conditions in the body.
Which row would cause the largest rise in cardiac output?
aortic blood pressure | blood pressure in the vena cava | carbon dioxide concentration of the blood | frequency of impulses in the Vagus nerve | |
A B C D | no change no change decrease decrease | decrease decrease no change no change | ncrease no change increase no change | no change increase no change increase |
A disease that causes a lower than normal heart rate is called ‘heart block’. When a doctor was treating a patient with this condition, he found that they had normal electrical impulses but these were not correctly conducted to the ventricles.
Which of the following could be faulty in the patient?
1 | atrioventricular node (AVN) |
2 | sinoatrial node (SAN) |
3 | Purkyne tissue |
Describe the roles of the sinoatrial node (SAN) and the atrioventricular node (AVN) in the initiation and control of the cardiac cycle.
After entering the right side of the heart, a red blood cell will pass through or pass by the following structures:
1 | tricuspid valve |
2 | semilunar valve |
3 | right atrium |
4 | right ventricle |
5 | sinoatrial node |
Which option shows the correct order that red blood cells will pass through?

