Weather Hazards
1. This question has 4 part(s).
1.1. Study the graph below showing the global number of extreme storm events between 1985 and 2015.
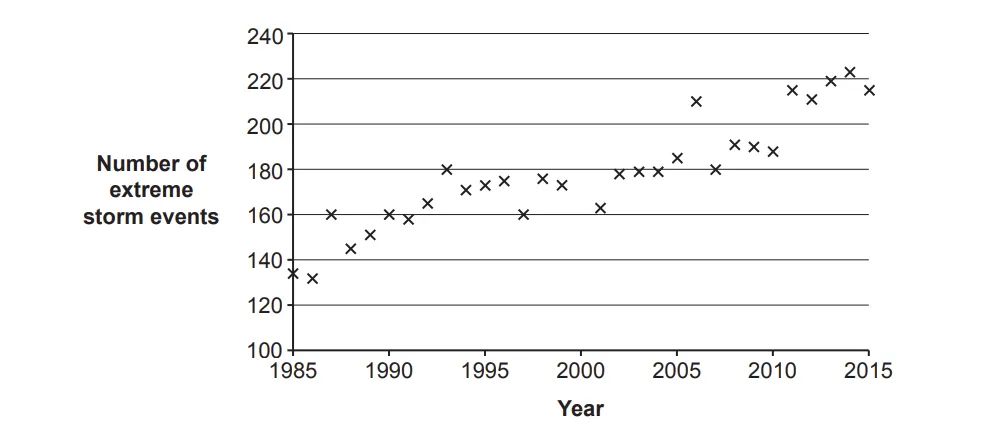
Use the data in the table to complete the graph.
Year | Number of extreme storm events |
2000 | 182 |
1.2. Add a trend line to the graph.
1.3. Identify the correct description of the relationship shown by the graph.
1.4. Identify the lowest number of global extreme events to occur in one year between 1995 and 2000.

Ai এর মাধ্যমে

১০ লক্ষ+ প্রশ্ন ডাটাবেজ

প্র্যাকটিস এর মাধ্যমে নিজেকে তৈরি করে ফেলো
উত্তর দিবে তোমার বই থেকে ও তোমার মত করে।

সারা দেশের শিক্ষার্থীদের মধ্যে নিজের অবস্থান যাচাই
No related questions found

