Scatter Graphs & Correlation
1. This question has 3 part(s).
1.1. The scatter diagram shows the results of 17 students in their French test and their German test.
Both tests are out of 100.
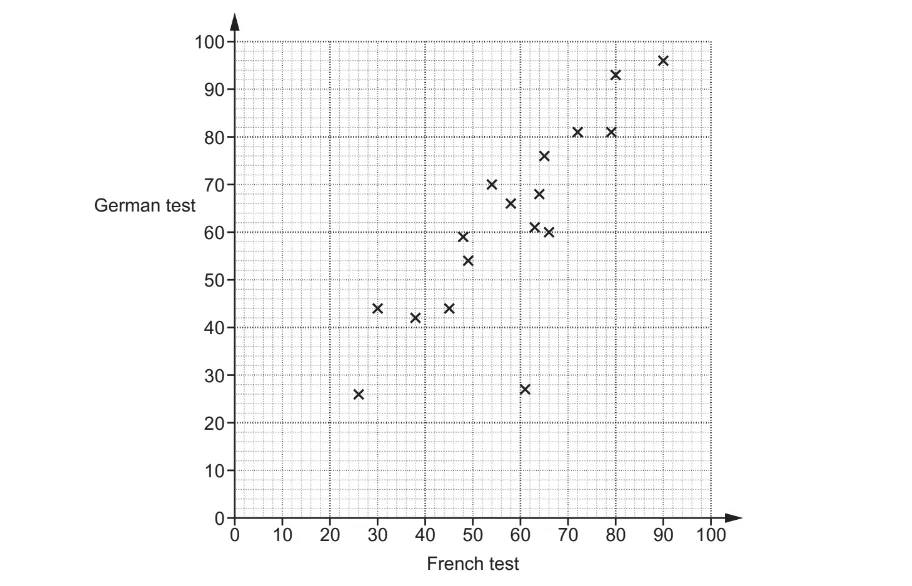
Here are the results of another 4 students.
French | 21 | 75 | 48 | 53 |
German | 30 | 78 | 46 | 61 |
Plot these results on the scatter diagram.
1.2. Describe the type and strength of the correlation shown in this diagram.
1.3. Work out the percentage of the students whose German result was higher than their French result.

Ai এর মাধ্যমে

১০ লক্ষ+ প্রশ্ন ডাটাবেজ

প্র্যাকটিস এর মাধ্যমে নিজেকে তৈরি করে ফেলো
উত্তর দিবে তোমার বই থেকে ও তোমার মত করে।

সারা দেশের শিক্ষার্থীদের মধ্যে নিজের অবস্থান যাচাই
No related questions found

