Scatter Diagrams & Correlation
1. This question has 4 part(s).
1.1. A university researcher is investigating the relationship between the number of hours students spend studying per week and their final exam scores in a mathematics course.
She used statistical software to draw a scatter diagram for her data.
Give one advantage of using statistical software when representing data.
1.2. The researcher calculated correlation coefficients for her data. She obtained the following results.
Spearman's rank correlation coefficient | 0.93 |
|---|---|
Pearson's product moment correlation coefficient | 0.84 |
(i) Describe and interpret the type of correlation represented by 0.93 in the table.
[2]
(ii) Which of the two correlation coefficients in the table represents the stronger correlation?
You must give a reason for your answer.
[1]
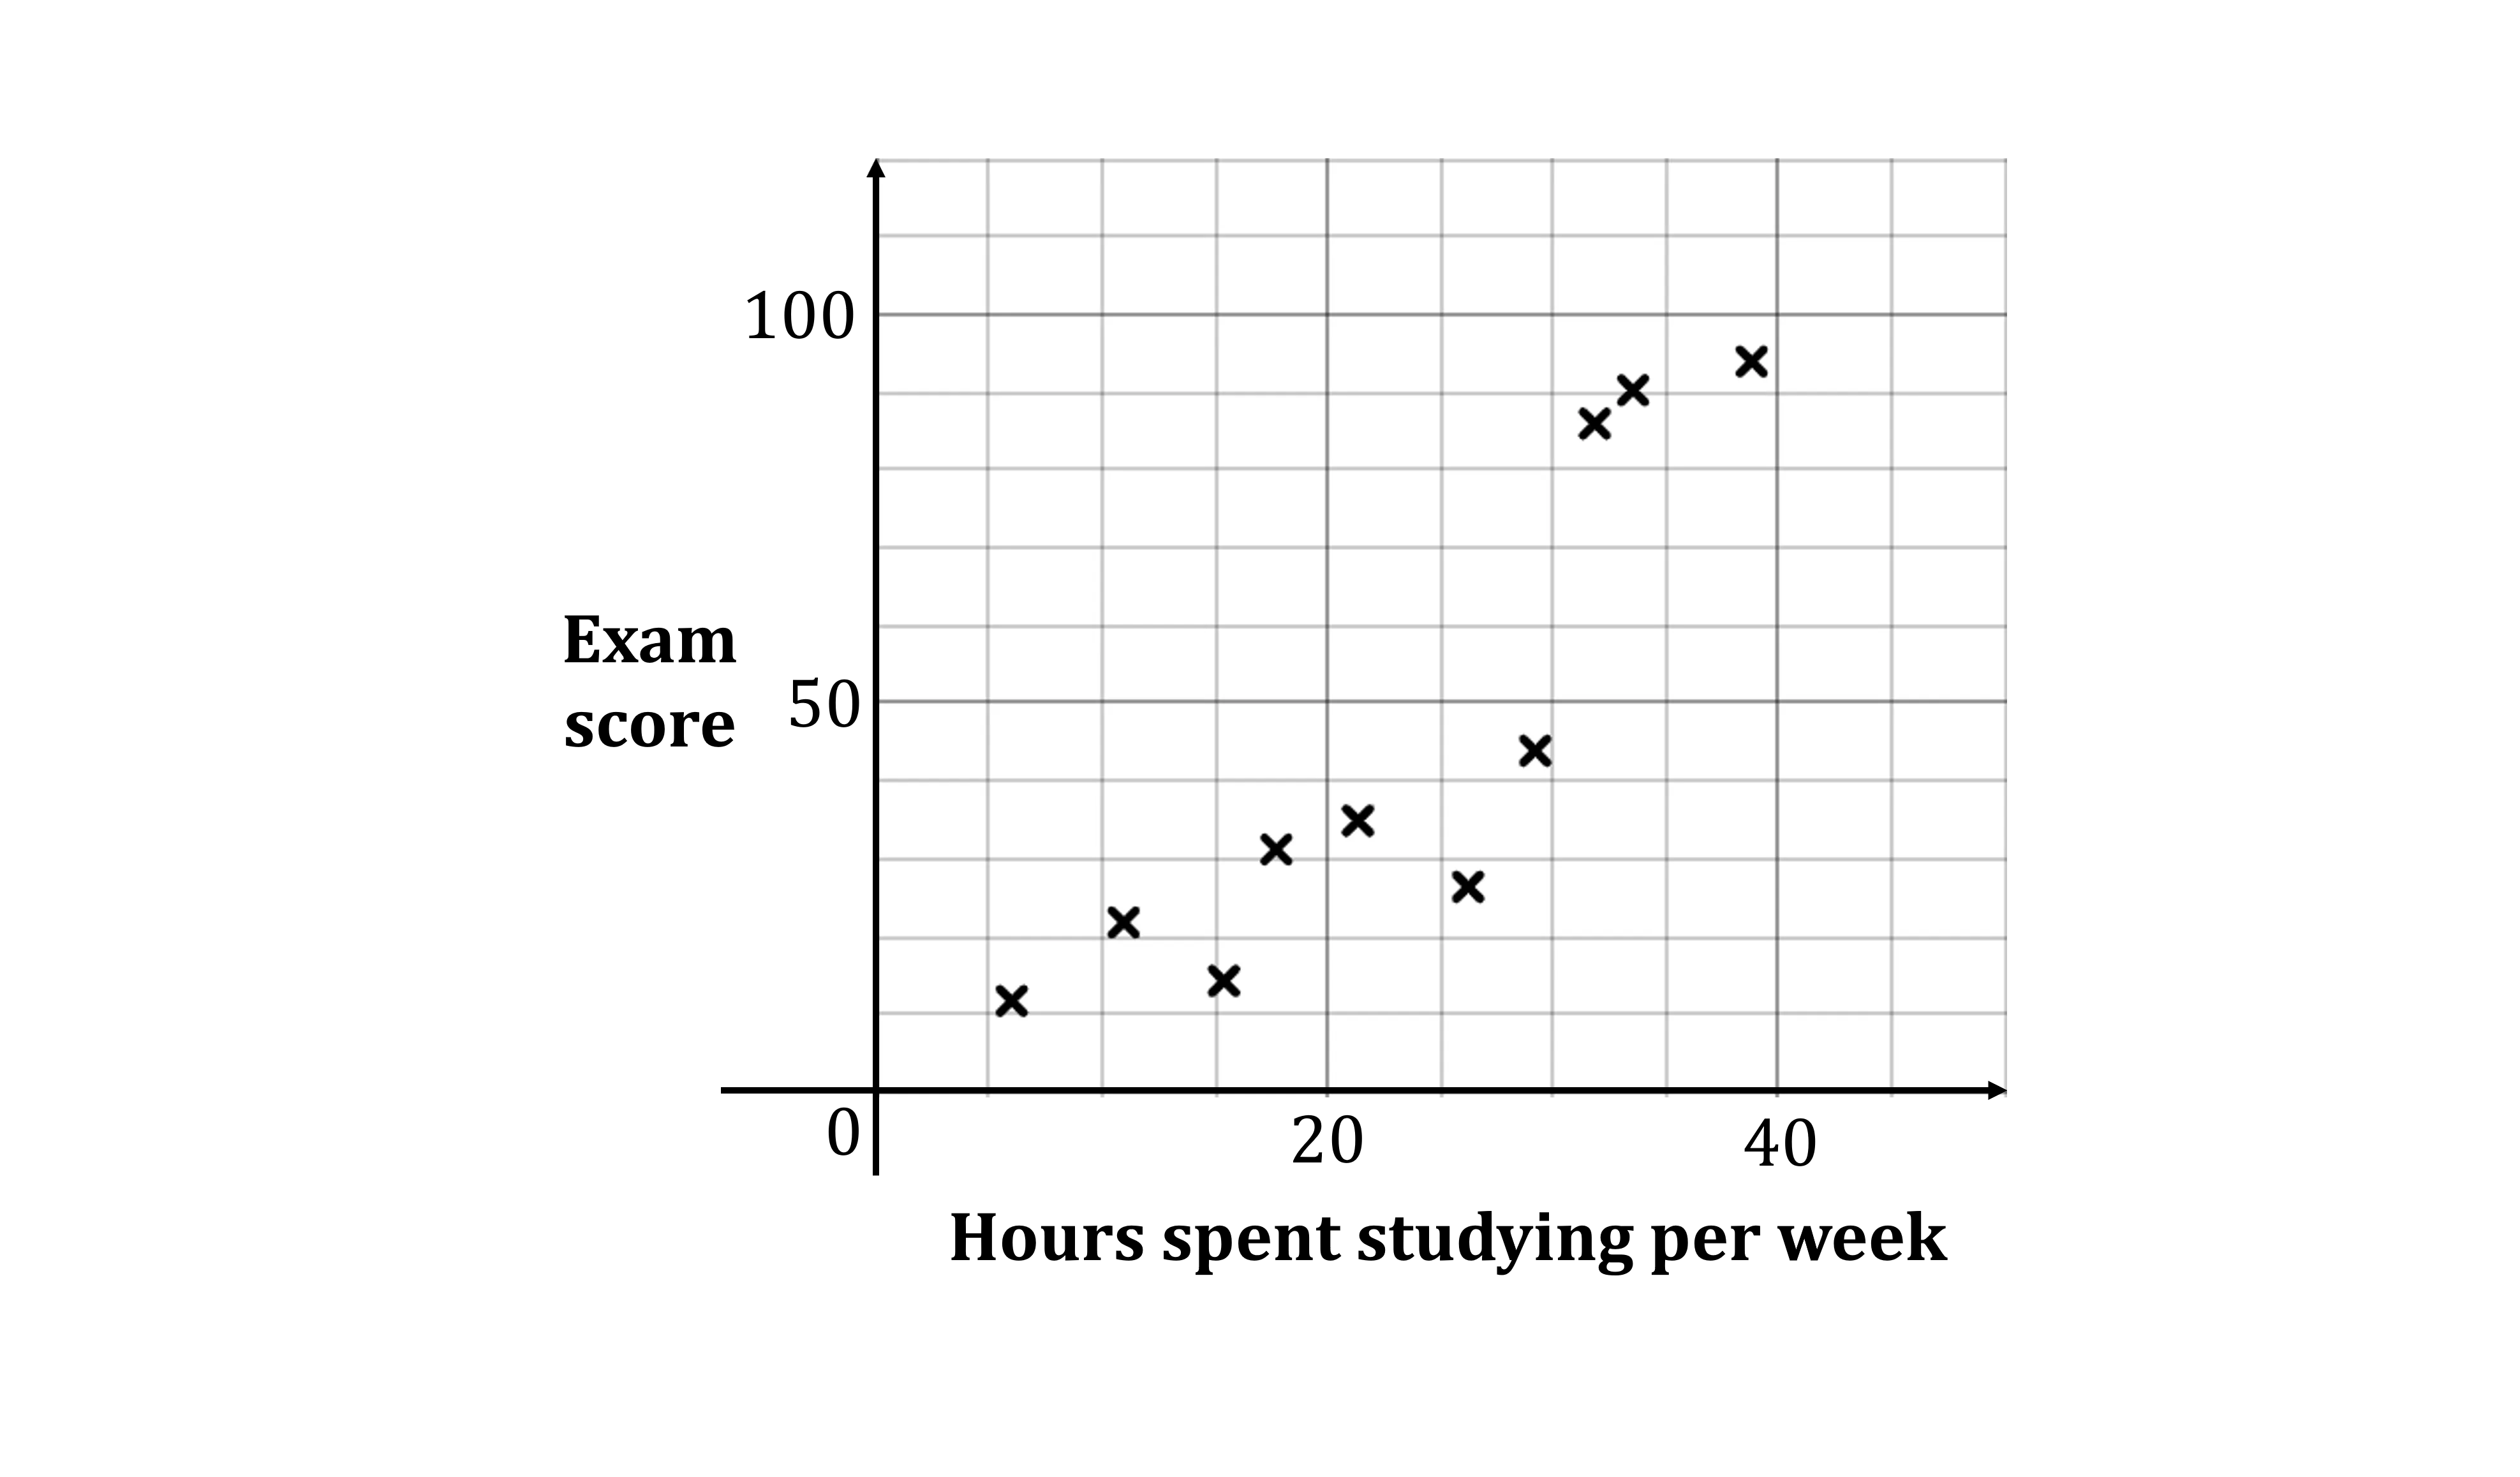
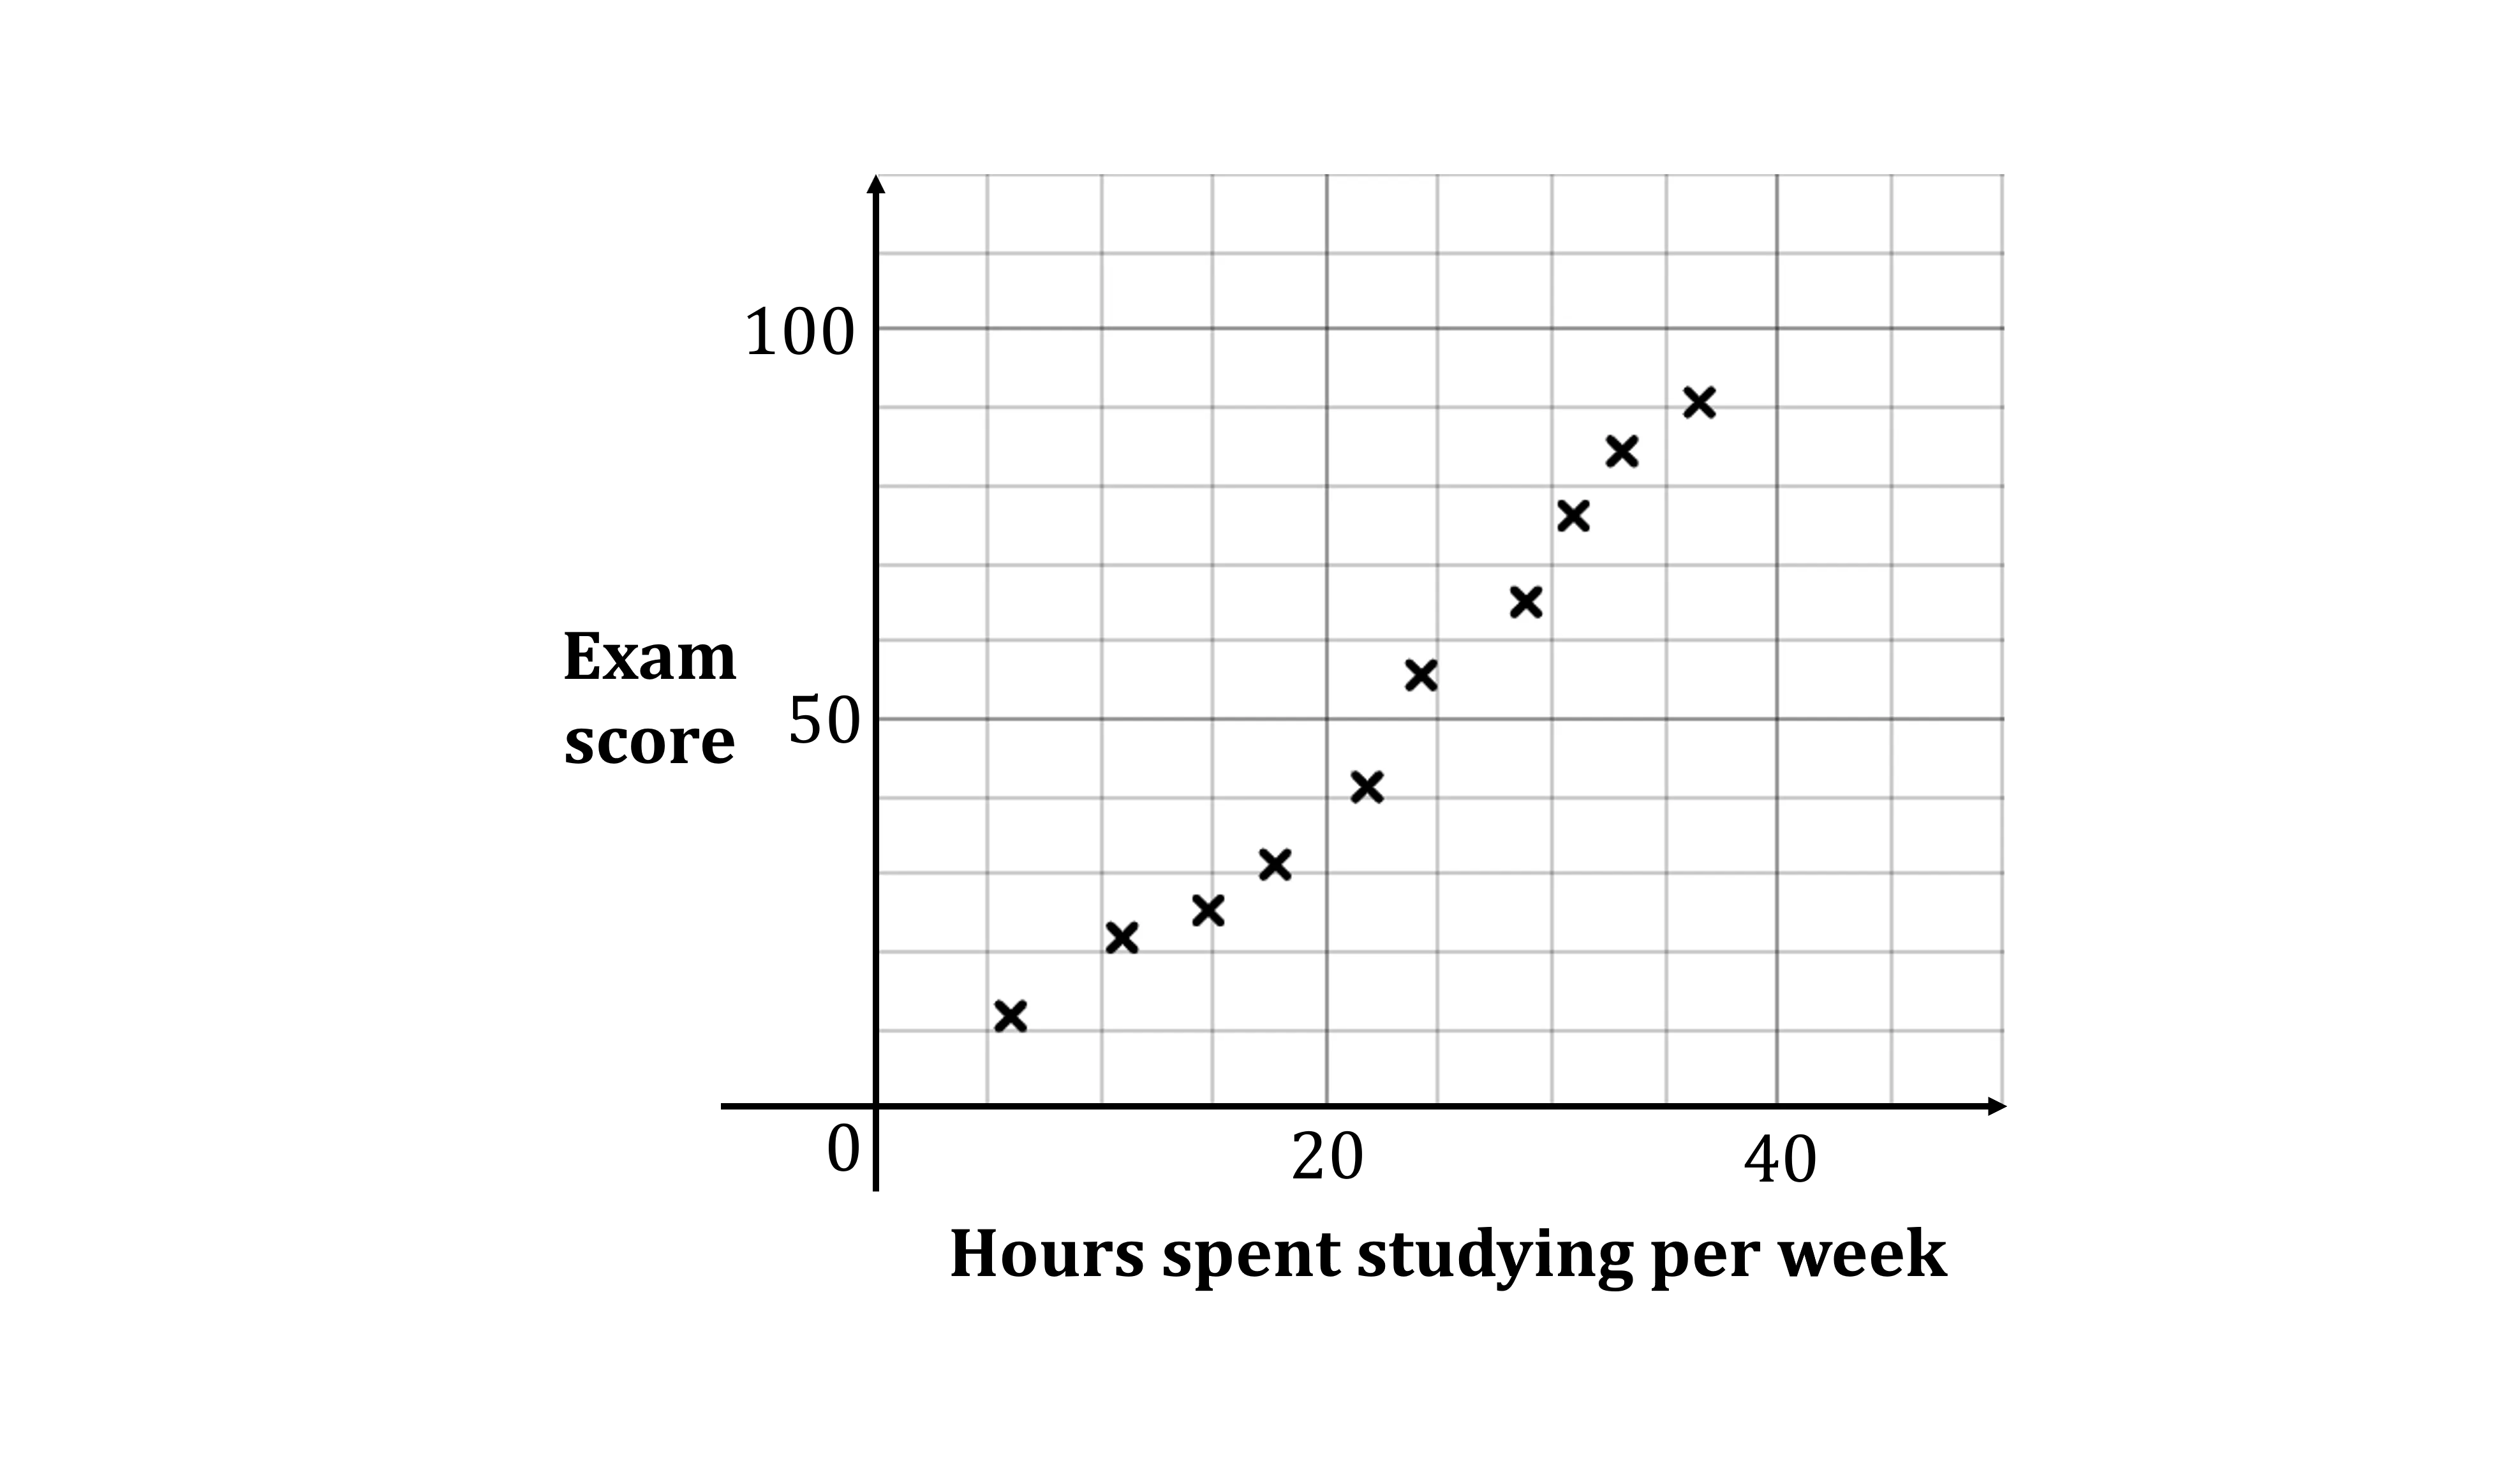
1.3. Figure 1 and Figure 2 show two possible scatter diagrams for the data.
Which one of these two diagrams most likely represents the data? You must give a reason for your answer.
1.4. The researcher wants to use a Pearson's product moment correlation coefficient (PMCC) to compare the test scores of male students with the test scores of female students.
Explain whether or not it is appropriate to use the PMCC to make this comparison.

Ai এর মাধ্যমে

১০ লক্ষ+ প্রশ্ন ডাটাবেজ

প্র্যাকটিস এর মাধ্যমে নিজেকে তৈরি করে ফেলো
উত্তর দিবে তোমার বই থেকে ও তোমার মত করে।

সারা দেশের শিক্ষার্থীদের মধ্যে নিজের অবস্থান যাচাই
No related questions found

