Graphical Skills
1. Figure 1.1 is a graph showing the value of imports and exports of Jamaica between 1960 and 2021.
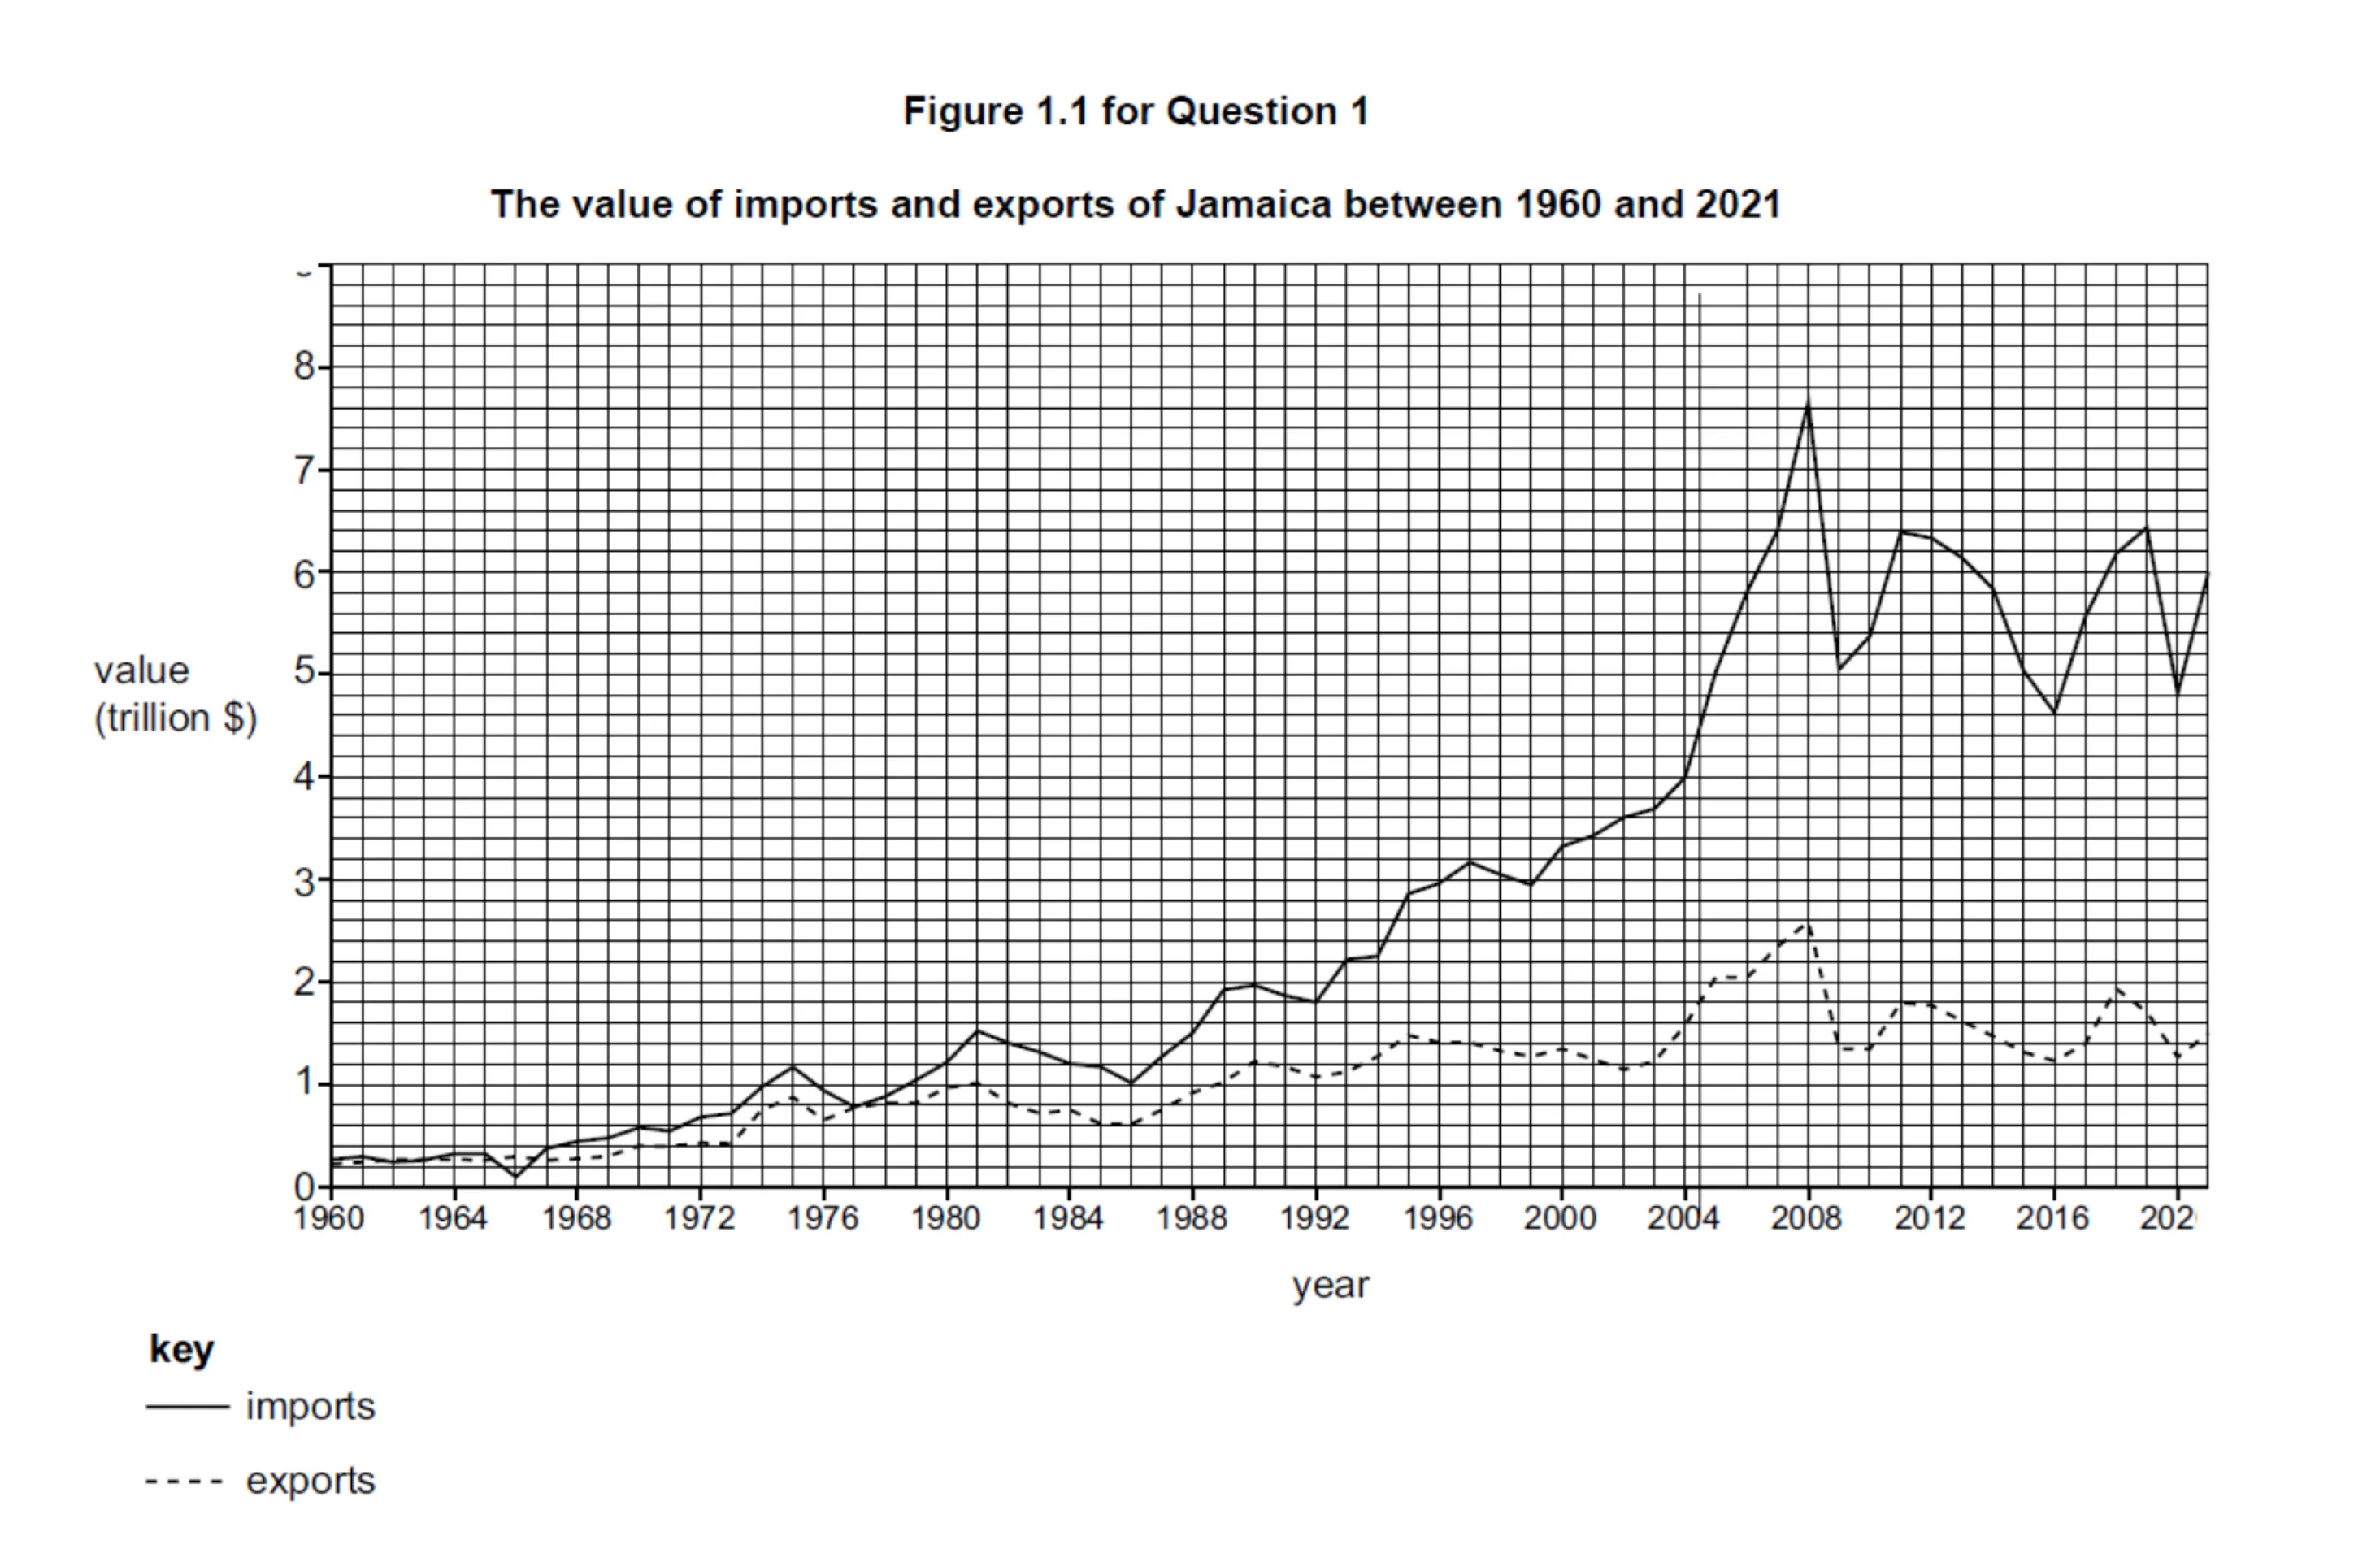
Use Figure 1.1 to compare the value of imports and exports of Jamaica between 1960 and 2021.

Ai এর মাধ্যমে

১০ লক্ষ+ প্রশ্ন ডাটাবেজ

প্র্যাকটিস এর মাধ্যমে নিজেকে তৈরি করে ফেলো
উত্তর দিবে তোমার বই থেকে ও তোমার মত করে।

সারা দেশের শিক্ষার্থীদের মধ্যে নিজের অবস্থান যাচাই
No related questions found

