Real-Life Graphs
1. This question has 4 part(s).
1.1. The graph shows the speed, v metres per second (m/s), of a car at time t seconds.
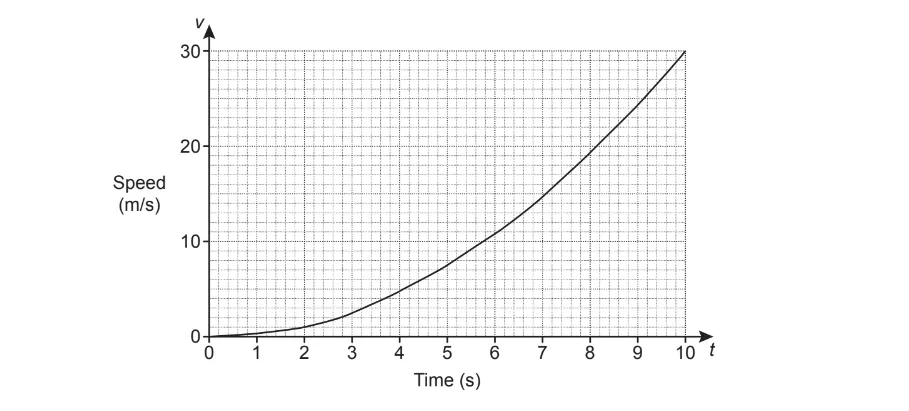
Find the speed of the car at t = 7.
.................................................... m/s
1.2. It is claimed that the car has accelerated from 0 to 60 miles per hour in the first 10 seconds.
Does the graph support this claim?
Show your reasoning. Use 1 mile = 1.6 kilometres.
1.3. Use the graph to estimate the acceleration at t = 7.
...................................................m/s2
1.4. Georgina says that the graph shows that the speed of the car will continue to increase after 10 seconds.
Make one comment to show that this statement is incorrect.

Ai এর মাধ্যমে

১০ লক্ষ+ প্রশ্ন ডাটাবেজ

প্র্যাকটিস এর মাধ্যমে নিজেকে তৈরি করে ফেলো
উত্তর দিবে তোমার বই থেকে ও তোমার মত করে।

সারা দেশের শিক্ষার্থীদের মধ্যে নিজের অবস্থান যাচাই
No related questions found

