Settlements & Service Provision
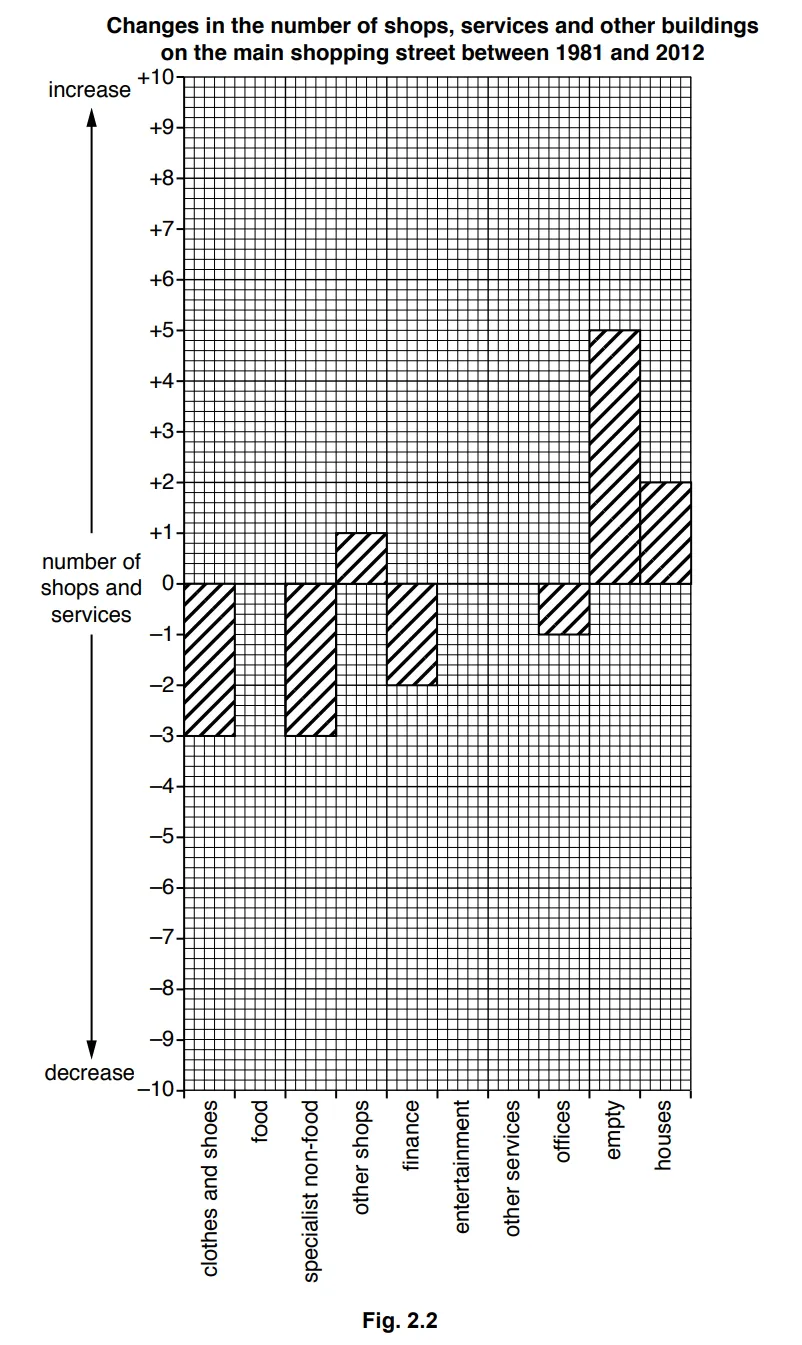
1. To compare the different shops and services in 1981 and 2012 the students produced Table 2.1 below.
Table 2.1
Number of shops, services and other buildings located on the main shopping street
Category | 1981 | 2012 |
Shops | ||
Clothes and shoes | 8 | 5 |
Food | 20 | 13 |
Specialist non-food (including bookshop, wool shop, chemist, mobile or cell phones, gift shop) | 29 | 26 |
Other shops | 3 | 4 |
Services | ||
Finance (including banks) | 9 | 7 |
Entertainment (including restaurant, café, bar) | 5 | 9 |
Other services (including doctor’s surgery, estate agent, optician, shoe repairs, solicitor) | 17 | 17 |
Office | 2 | 1 |
Other buildings | ||
Empty (vacant) building | 4 | 9 |
House (residential) | 12 | 14 |
Total | 109 | 105 |
(i)
The students obtained the data for 1981 from an old map of the area. Which one of the following is the correct description of this old map? Tick (✓) your choice.
Tick (✓) | |
primary source of data | |
secondary source of data | |
tertiary source of data |
[1]
(ii)
The students used Table 2.1 to draw the graph, Fig. 2.2, below. Complete the graph to show the changes in the number of food shops and entertainment services.
[2]
(iii)
What conclusion would the students make about Hypothesis 1: Shops and services on the main shopping street have changed between 1981 and 2012? Support your decision with evidence from Table 2.1 and Fig. 2.2.
[4]

Ai এর মাধ্যমে

১০ লক্ষ+ প্রশ্ন ডাটাবেজ

প্র্যাকটিস এর মাধ্যমে নিজেকে তৈরি করে ফেলো
উত্তর দিবে তোমার বই থেকে ও তোমার মত করে।

সারা দেশের শিক্ষার্থীদের মধ্যে নিজের অবস্থান যাচাই
No related questions found

