Working with Data
1. This question has 3 part(s).
1.1. The incomplete box plot below shows data from the large data set regarding cloud cover between May and October 2015 in Cambourne. Cloud cover is measured in Oktas on a scale from 0 (no cloud cover) to 8 (full cloud cover).
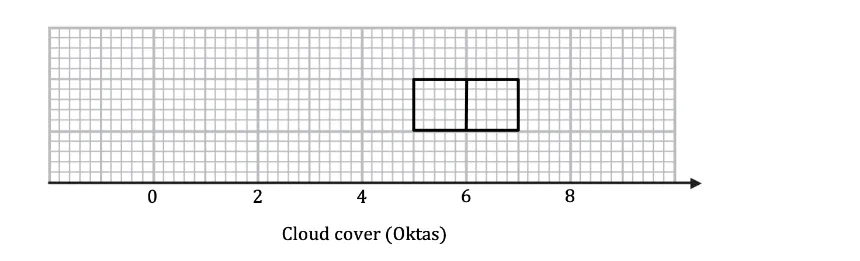
Find the interquartile range.
1.2. An outlier is defined as any data value that falls either more than 1.5 (interquartile range) above the upper quartile or less than 1.5 (interquartile range) below the lower quartile.
(i) Find the boundaries (fences) at which outliers are defined.
(ii) Explain why, using your knowledge of how cloud cover is measured in the large data set, there cannot be any high valued outliers.
1.3. Complete the box plot given that, where appropriate, the maximum and minimum values should be located at the boundaries (fences) at which outliers are defined. (You are not required to mark any outliers on the box plot.)

Ai এর মাধ্যমে

১০ লক্ষ+ প্রশ্ন ডাটাবেজ

প্র্যাকটিস এর মাধ্যমে নিজেকে তৈরি করে ফেলো
উত্তর দিবে তোমার বই থেকে ও তোমার মত করে।

সারা দেশের শিক্ষার্থীদের মধ্যে নিজের অবস্থান যাচাই
No related questions found

