Analyzing Maps/Graphs/Charts
Look at the following pie-chart. It shows the choice of professions by different educated youths in Bangladesh. Now, describe the pie-chart in your own words. You are advised to highlight and summarize information given in the pie-chart.
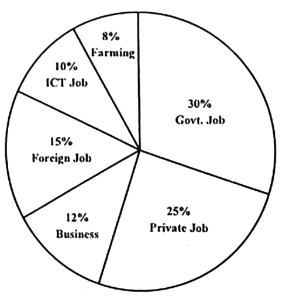
The pie chart shows the choice of professions by different educated young people. The professions are arranged in 6 categories namely Govt. job, private sector job, foreign job, business, ICT related job and farming. The pie chart shows that the highest number of people ( ) prefer Govt. job while farming is chosen by the least number of educated people ( ) as profession. Then comes the private sector which is chosen by educated people. The percentage of people preferring foreign job is . As a profession, business is liked by while ICT by . From the pie chart, it is understood that educated people are not much interested in farming though Bangladesh is an agricultural country. So, from the analysis of the chart, it can be said that most of the educated people are running after jobs instead of becoming self-employed by doing farming or business.
Ai এর মাধ্যমে
১০ লক্ষ+ প্রশ্ন ডাটাবেজ
প্র্যাকটিস এর মাধ্যমে নিজেকে তৈরি করে ফেলো
উত্তর দিবে তোমার বই থেকে ও তোমার মত করে।
সারা দেশের শিক্ষার্থীদের মধ্যে নিজের অবস্থান যাচাই
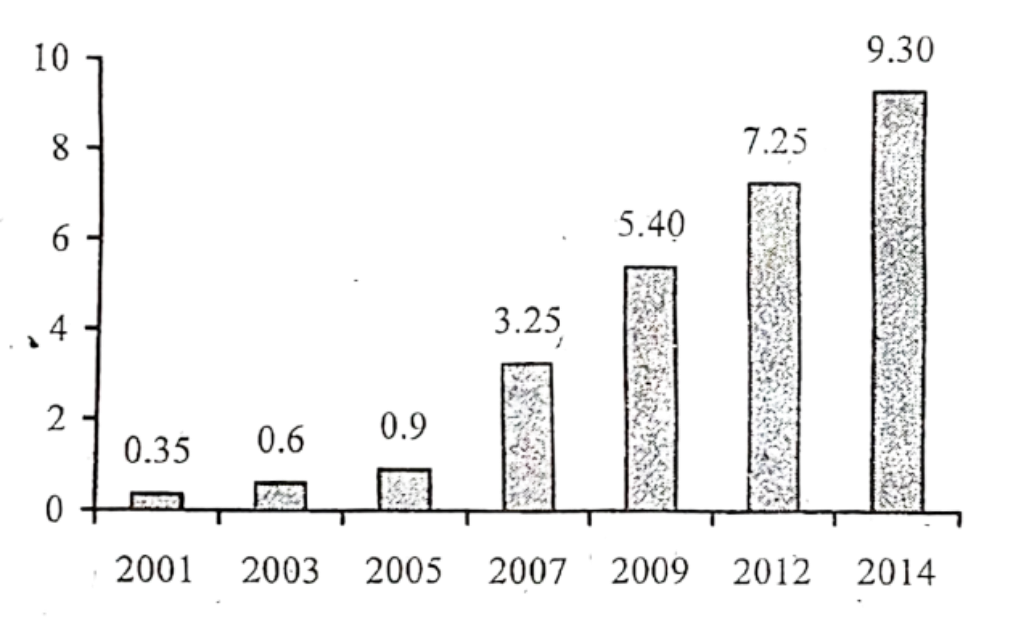
The graph below shows "The Number of Telephione and Mobile Users" from 2001 to 2014. Describe the graph in 150 words. You should highlight and summarize the information given in the graph.
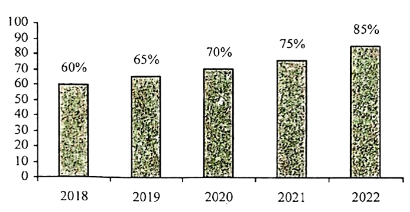
The graph below shows the poverty reduction rate of Bangladesh from 2018 to 2022. Describe the graph in 150 words. You should highlight and summarize the information given in the graph.
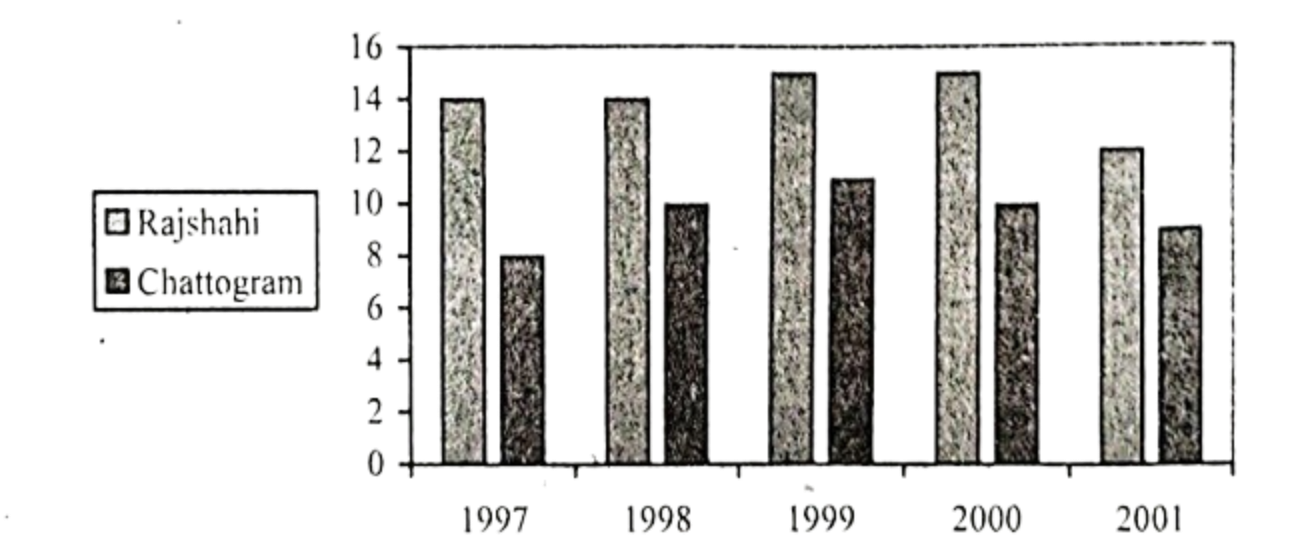
The chart below shows the minimum temperature (in Celsius) at Chattogram and Rajshahi in the years between 1997 and 2001. Describe the chart in 150 words. You should highlight and summarize the information given in the chart.
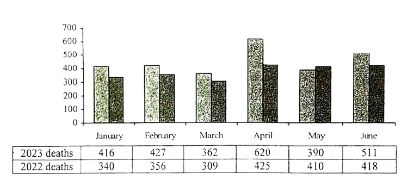
Look at the following graph. It shows the comparative number of death caused by road accidents in the first six months of the year 2022 and 2023. Now, describe the graph in your own words in 150 words. You are advised to highlight and summarize the information given in the graph.
Comparative number of deaths caused by road accidents in Bangladesh in the first six months of the year 2022-2023: