Loading ...
11. Analyzing maps / graphs / charts
The graph below shows the impact of COVID-19 on mental health. Describe the graph highlighting and summarizing the information given in the graph.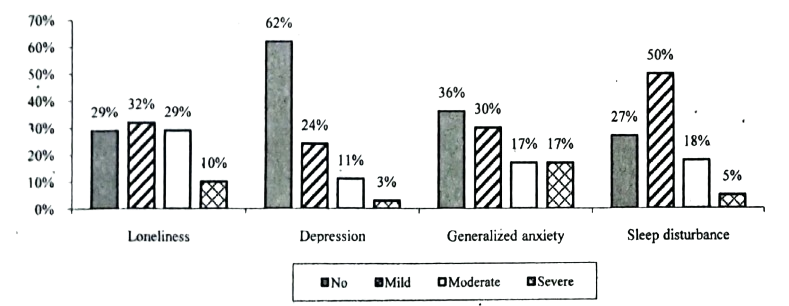
The graph shows the impact of COVID-19 on mental health. The graph portrays a comparative study of four major psychological problems that people faced due to the COVID-19 pandemic. From the graph, it is quite clear that people are mostly suffering from sleep disturbance, which is . Though it is mild, highest number of people suffer from it whereas people have no sleep disturbance and have moderate and have severe sleep disturbance. Again, while people suffer from mild loneliness, feel moderately lonely and face severe loneliness. And people doesn't feel lonely at all. Though people have no depression, people have mild depression. About people are moderately depressed whereas people are severely depressed. In respect of generalized anxiety, people suffer from it moderately, and suffer from it severely. While people have no anxiety disorder, people have mild anxiety disorder. However, from the analysis of the graph, it can be concluded that the COVID-19 pandemic has greatly affected us psychologically, and we should take immediate steps to improve our mental health.
Ai এর মাধ্যমে
১০ লক্ষ+ প্রশ্ন ডাটাবেজ
প্র্যাকটিস এর মাধ্যমে নিজেকে তৈরি করে ফেলো
উত্তর দিবে তোমার বই থেকে ও তোমার মত করে।
সারা দেশের শিক্ষার্থীদের মধ্যে নিজের অবস্থান যাচাই
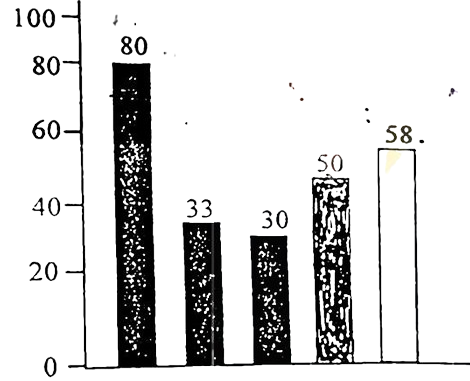
The graph below shows the importance and usage of English. Describe the graph in at least 80 words:
 (By serial)
Usage of English in information technology 80%
Usage of English as the 1st language 33%
Used in various organizations 30%
Used in other purposes 50%
Using English as the 2nd language 58%
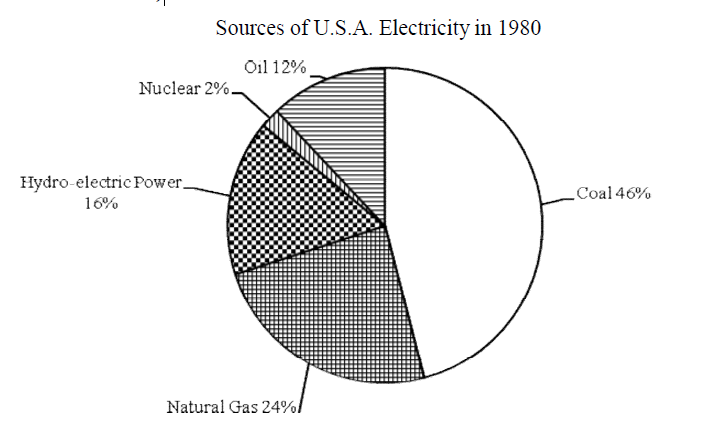
Look at the chart. It shows the sources of U.S.A. electricity in 1980. Now, analyze the chart focusing the main
aspects (At least in 150 words)
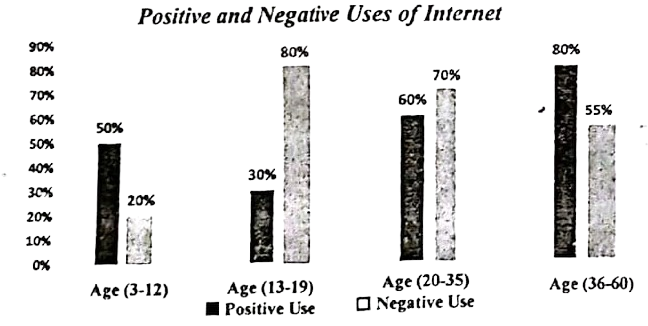
The graph below shows the positive and negative Uses of Internet according to different age groups of the users. Describe the chart at least in 150 words. You should highlight the information and report the main features given in the chart.
Look at the chart. It shows COVID-19 Pandamic cases and deaths by 5 countries on 15 June, 2022. Describe the chart focusing the important aspects and analyse the result in 80 words.
Country | Total Cases | Total Deaths |
|---|---|---|
United States | 857,58,638 | 10,11,925 |
Brazil | 315,41,479 | 6,68,354 |
India | 432,45,517 | 5,24,792 |
United Kingdom | 224,99,617 | 1,79,539 |
Bangladesh | 19,54,405 | 29,131 |