Probability Diagrams - Venn & Tree Diagrams
1. 72 children are asked whether they have a laptop or an iPad.
31 have a laptop.
48 have an iPad.
12 have both.
5 have neither.
Represent this information on a Venn diagram.


Ai এর মাধ্যমে

১০ লক্ষ+ প্রশ্ন ডাটাবেজ

প্র্যাকটিস এর মাধ্যমে নিজেকে তৈরি করে ফেলো
উত্তর দিবে তোমার বই থেকে ও তোমার মত করে।

সারা দেশের শিক্ষার্থীদের মধ্যে নিজের অবস্থান যাচাই
In a survey, 60 students were asked whether they have a bank account (B) and whether they have a part-time job (J).
The number of students who had neither a bank account nor a part-time job was x.
The Venn diagram shows the results in terms of x.
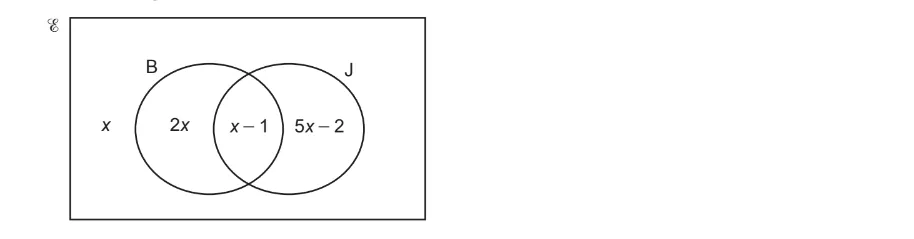
One of the 60 students is chosen at random. Find the probability that they have a bank account. Show your working.
Sami asked 50 people which drinks they liked from tea, coffee and milk.
All 50 people like at least one of the drinks
19 people like all three drinks.
16 people like tea and coffee but do not like milk.
21 people like coffee and milk.
24 people like tea and milk.
40 people like coffee.
1 person likes only milk.
Sami selects at random one of the 50 people.
Work out the probability that this person likes tea.
Work out the probability that Roberto takes two small glasses.
ξ = 29 students in a class
C = students who own a cat
D = students who own a dog
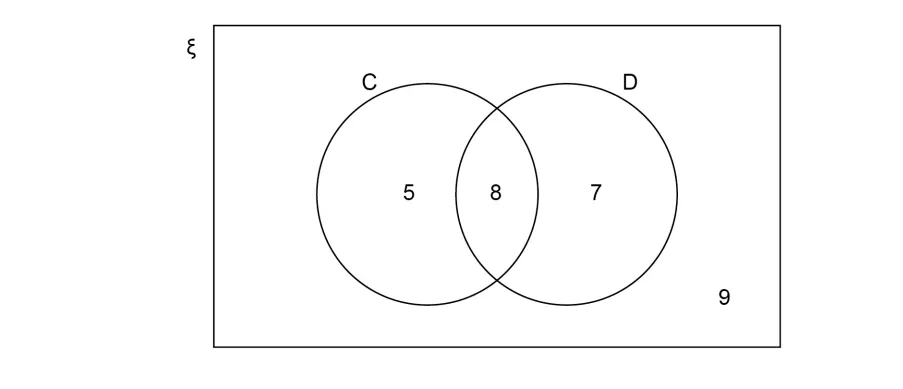
A student is chosen at random.
Circle the probability that the student owns a cat or a dog but not both.

